Axis label position

Dear expert:

I’d like to change the axis label position to the left of the tick. Like ROOT: TGaxis Class Reference
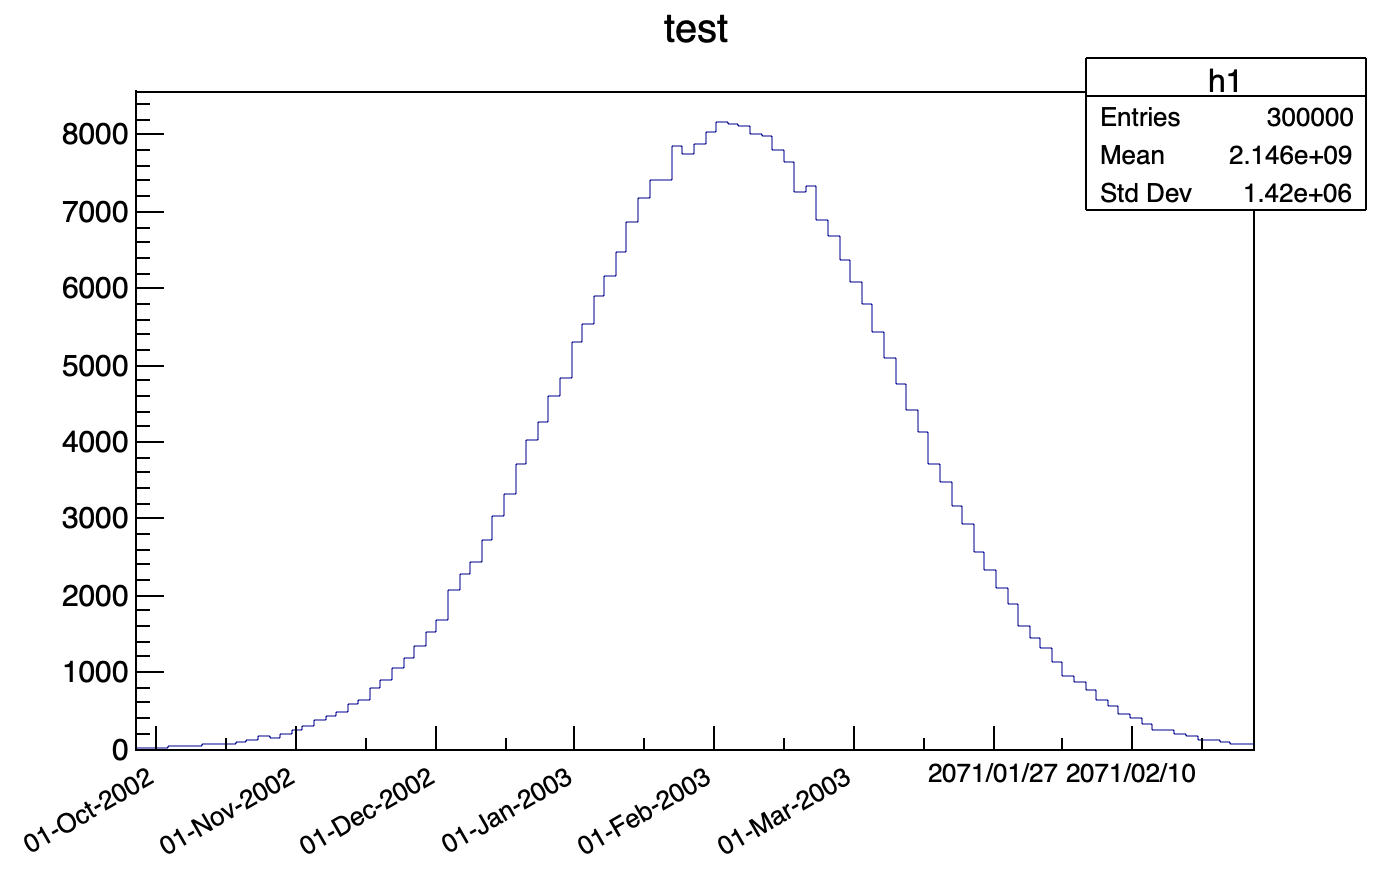
Here is my plot:

I found a relavant function: xaxis.SetOption() here: SetOption()

But when I use root, whatever version, there is no such a function: SetOption(). I only have SetDrawOption(). I am not sure how to use this in a python script.

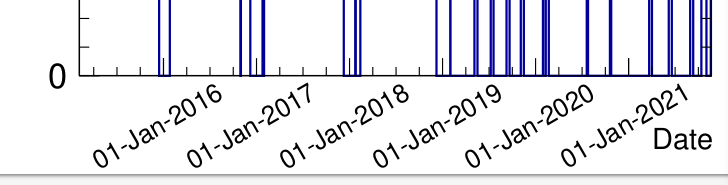
For example, I have an x-axis.
My settings are:

xlabel_angle = 30                                                                                    
xaxis.ChangeLabel(1,xlabel_angle,-1,-1,-1,-1,"01-Jan-2016");                                         
xaxis.ChangeLabel(2,xlabel_angle,-1,-1,-1,-1,"01-Jan-2017");                                         
xaxis.ChangeLabel(3,xlabel_angle,-1,-1,-1,-1,"01-Jan-2018");                                         
xaxis.ChangeLabel(4,xlabel_angle,-1,-1,-1,-1,"01-Jan-2019");                                         
xaxis.ChangeLabel(5,xlabel_angle,-1,-1,-1,-1,"01-Jan-2020");                                         
xaxis.ChangeLabel(6,xlabel_angle,-1,-1,-1,-1,"01-Jan-2021");                                         
xaxis.SetDrawOption('L')

But xaxis.SetDrawOption(‘L’) doesn’t work.

Could you please help me with that?
Thanks so much!

Cheers,
Yingjie


Please read tips for efficient and successful posting and posting code

ROOT Version: Not Provided
Platform: Not Provided
Compiler: Not Provided


I’m sure @couet has a solution for this

What is xaxis ? a TAxis or a TGaxis ?

I see my error. The xaxis is TAxis, not TGaxis.

But in this case, how to do that? especially in a python script.

Thanks a lot for your prompt reply.

Can you provide a small script showing what you are doing exactly ?

Hi couet:

The xaxis is basically from:

xaxis = hist.GetXaxis()

where hist is a TH1F.

The program (I used from others) is a bit complicated. If you’d like to have a look, you can find the relevant lines: in lines 819 to 844 in public_plot.py

I’d like to change line 845 to make the position of the end of each label is close to the tick.

Thanks a lot!

Hi @couet:

I have written a small script here, and hope this is helpful.

from ROOT import TCanvas,TDatime,TRandom,TH1F,gStyle,gROOT
gROOT.SetBatch(1)

ct2 = TCanvas("ct2","ct2",10,10,700,500)
T0=TDatime(2003, 1, 1, 0, 0, 0)
X0 = T0.Convert()
gStyle.SetTimeOffset(X0)
# Define the lowest histogram limit as 2002, September 23rd
T1=TDatime(2002, 9, 23, 0, 0, 0)
X1 = T1.Convert()-X0
# Define the highest histogram limit as 2003, March 7th
T2=TDatime(2003, 3, 7, 0, 0, 0)
X2 = T2.Convert(1)-X0;
h1 = TH1F("h1","test",100,X1,X2)
r = TRandom()
for i in range(300000):
    noise = r.Gaus(0.5*(X1+X2),0.1*(X2-X1));
    h1.Fill(noise)

xaxis = h1.GetXaxis()
xaxis.SetTimeDisplay(1);
xaxis.SetLabelSize(0.03);
xaxis.SetTimeFormat("%Y/%m/%d")


xaxis.SetLabelOffset(0.035)
xlabel_angle = 30
xaxis.ChangeLabel(1,xlabel_angle,-1,-1,-1,-1,"01-Oct-2002");
xaxis.ChangeLabel(2,xlabel_angle,-1,-1,-1,-1,"01-Nov-2002");
xaxis.ChangeLabel(3,xlabel_angle,-1,-1,-1,-1,"01-Dec-2002");
xaxis.ChangeLabel(4,xlabel_angle,-1,-1,-1,-1,"01-Jan-2003");
xaxis.ChangeLabel(5,xlabel_angle,-1,-1,-1,-1,"01-Feb-2003");
xaxis.ChangeLabel(6,xlabel_angle,-1,-1,-1,-1,"01-Mar-2003");

#how to change this line

#xaxis.SetOption('L')

#AttributeError: 'TAxis' object has no attribute 'SetOption'

h1.Draw('hist')
ct2.SaveAs('xaxis_label_left.png')
void ying(){
   auto ct2 = new TCanvas("ct2","ct2",10,10,700,500);
   auto T0 = new TDatime(2003, 1, 1, 0, 0, 0);
   auto X0 = T0->Convert();
   gStyle->SetTimeOffset(X0);
   // Define the lowest histogram limit as 2002, September 23rd
   auto T1= new TDatime(2002, 9, 23, 0, 0, 0);
   auto X1 = T1->Convert()-X0;
   // Define the highest histogram limit as 2003, March 7th
   auto T2 = new TDatime(2003, 3, 7, 0, 0, 0);
   auto X2 = T2->Convert(1)-X0;
   TH1F *h1 = new TH1F("h1","test",100,X1,X2);
   auto r = new TRandom();
   for (int i=0; i<300000; i++) {
       auto noise = r->Gaus(0.5*(X1+X2),0.1*(X2-X1));
       h1->Fill(noise);
   }
   auto xaxis = h1->GetXaxis();
   xaxis->SetTimeDisplay(1);
   xaxis->SetLabelSize(0.03);
   xaxis->SetTimeFormat("%Y/%m/%d");

   xaxis->SetLabelOffset(0.01);
   float xlabel_angle = 30;
   xaxis->ChangeLabel(1,xlabel_angle,-1,31,-1,-1,"01-Oct-2002");
   xaxis->ChangeLabel(2,xlabel_angle,-1,31,-1,-1,"01-Nov-2002");
   xaxis->ChangeLabel(3,xlabel_angle,-1,31,-1,-1,"01-Dec-2002");
   xaxis->ChangeLabel(4,xlabel_angle,-1,31,-1,-1,"01-Jan-2003");
   xaxis->ChangeLabel(5,xlabel_angle,-1,31,-1,-1,"01-Feb-2003");
   xaxis->ChangeLabel(6,xlabel_angle,-1,31,-1,-1,"01-Mar-2003");

   h1->Draw("hist");
}

Thanks so much!

1 Like

This topic was automatically closed 14 days after the last reply. New replies are no longer allowed.