Hello all!
This is a very naive issue.
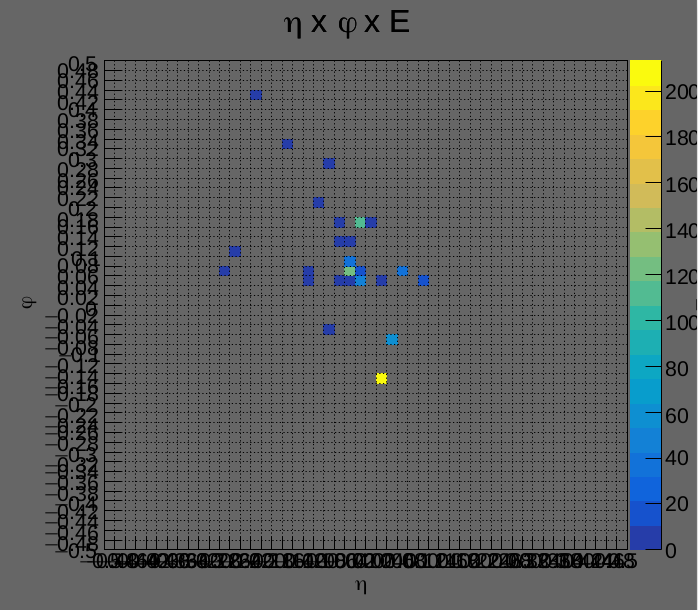
I’m trying to plot a 2D histogram with a grid. My histogram covers a region from -0.5 to 0.5, both in eta and phi. My original ideia was to set a 0.02 x 0.02 grid, and so I created 50 divisions to each axis.
The problem is: now I have 50 labels in the axes as well. My intention was to maintain 10 labels in each axis (-0.5,-0.4,…,etc) but keep the 0.02x0.02 grid.
I know that this problem was fixed in a post(Grid, axis and "numbers" of a histogram) using a TPad grid, but I really did not understand the parameters of the grid there.
Here is my code and the plot:
#include <iostream>
#include <fstream>
#include <cmath>

#ifdef __CLING__
R__LOAD_LIBRARY(libDelphes)
#include "classes/DelphesClasses.h"
#include "external/ExRootAnalysis/ExRootTreeReader.h"
#endif

void transf_deposition(){
	gSystem->Load("libDelphes");

    TChain chain("Delphes");
 	chain.Add("tag_1_delphes_events500.root");

 	// Create object of class ExRootTreeReader
    ExRootTreeReader *treeReader = new ExRootTreeReader(&chain);
	TClonesArray *branchJet = treeReader->UseBranch("Jet");
	TClonesArray *branchTower = treeReader->UseBranch("Tower");
	TClonesArray *branchParticle = treeReader-> UseBranch ("Particle");


	//Declara o canvas
    TCanvas *c1 = new TCanvas("c1","c1",200,200);
    c1->SetLeftMargin(0.15);
    c1->SetFillColor(13);
    c1 -> SetGrid();

    //Declare the lego histogram
    TH2F *hist_lego = new TH2F("hist_lego","#eta x #phi x E", 50, -0.5, 0.5,50, -0.5, 0.5);
    hist_lego -> GetXaxis()->SetTitle("#eta");
    hist_lego -> GetYaxis()->SetTitle("#phi");
    hist_lego -> GetZaxis()->SetTitle("E");

    hist_lego -> GetXaxis()->CenterTitle();
    hist_lego -> GetYaxis()->CenterTitle();
    hist_lego -> GetZaxis()->CenterTitle();

    hist_lego -> GetXaxis() -> SetNdivisions(50);
   	hist_lego -> GetYaxis() -> SetNdivisions(50);


   	/*
		Lines that fill the histogram
   	*/


	gStyle->SetPalette(kBird);
	hist_lego ->SetStats(0);

	hist_lego->Draw("colz");

	c1 -> Print("/home/ecaue/ParticlePhysics/TCC/Codes/Transformações/deposition.pdf");

}