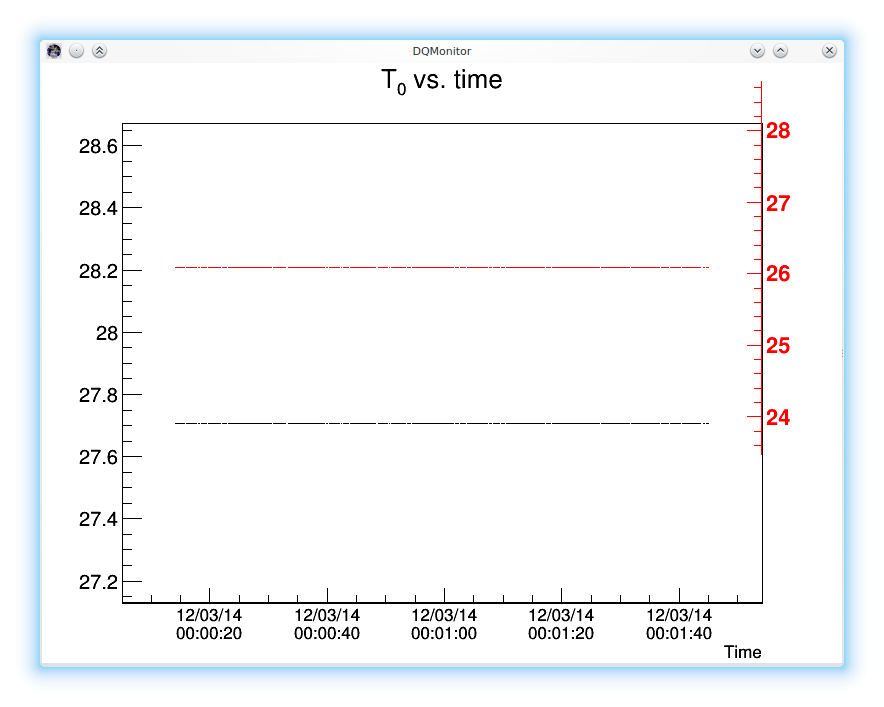
I’m drawing a plot with two graphs of two different quantities, creating a second Y axis followingthis example. Everything works fine, except for one thing: when zooming out by click and drag on the primary Y axis or by setting the user range, the second one is not extended (see the attached image). Is there a way to automate this resize? I’m writing a program with a GUI using Qt and embedding the Root canvas in a Qt widget, so using the Qt terminology I guess that I could connect the zoom out signal emitted by the canvas/histo to a slot which redraws the secondary axis.
Is this feasible? I never used the signal/slot infrastructure of Root, so I don’t really know if what I’m saying makes sense. Thanks.
Yes the TGaxis is not ware a zoom occurred.
May be putting the TGaxis in a TExec will help.
I have been able to connect the RangeAxisChanged signal from TCanvas to a method of the Qt widget embedding the canvas. The method emits a Qt signal, so the net effect is that a resize emits a Qt signal. I attach the code for reference, in case someone will encounter the same problem.
Thanks.
QRootCanvas.h (1.12 KB)
QRootCanvas.cpp (3.55 KB)