Suppose I have a TGraph with a lot of points, I want to plot only a small part of them. In particual suppose the X range of the graph is from 0 to 100. I want to plot only from 0 to 50, so I can use TGraph::GetXaxis()->SetRangeUser(0,50); But what about the y range? I want to auto adjust it.
The big problem is that I want to plot the range 0->50 in a subcanvas, and the range 50->100 in another subcanvas.
Ah ok … sorry, I read to fast. The word “auto-adjust” made me think that …
If you set a range along X the the Y range will be such that all data are shown …
I do not really understand your point.
[quote=“couet”]Ah ok … sorry, I read to fast. The word “auto-adjust” made me think that …
If you set a range along X the the Y range will be such that all data are shown …
[/quote]
yes, this is what I want
[quote=“couet”]
I do not really understand your point.[/quote]
do not?
[quote=“couet”]Ok … better speak on a running example otherwise we will never converge…
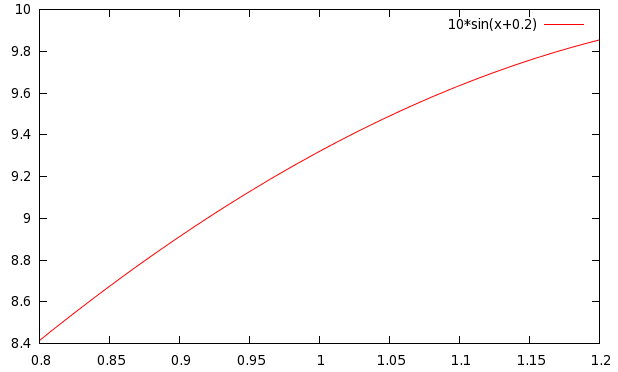
The following macro gives me a correct Y range.
[code]
{
TCanvas *c1 = new TCanvas(“c1”,“A Simple Graph Example”,200,10,700,500);
const Int_t n = 20;
Double_t x[n], y[n];
for (Int_t i=0;i<n;i++) {
x[i] = i0.1;
y[i] = 10sin(x[i]+0.2);
}
gr = new TGraph(n,x,y);
gr->Draw(“ACP”);
gr->GetXaxis()->SetRangeUser(0.8,1.2);
}
[/code][/quote]
Why do you think this is correct? The minimum of your function in the interval is near 8.5, the maximum near 9.5. The range of the y axis is from 1 to 11. Why for example the funcion is not vertically centered, for example with an interval 8.0, 10 ?
Try to run your code without the last line, you got a plot where x range is from 0 to 2 and the y range is from… 1 to 11!!! So your last line doesn’t change the y range.
TGraph is a very basic function used by many other complex objects. TGraph cannot not be too sophisticated. An automatic adjustment, as you suggest, will mess up the drawing of objects based on TGraph. We cannot do what you suggest. The automatic Y scale is done by the more complex objects like histograms.