Automatic change of roofit range lead to a time consuming numerical integration!

Dear all,
Recently, I am confused when using roofit.
I construct a total pdf contains different components, and use it to perform fit.
However the fit range changes automatically, and the pdf lead a numerical integration which is time consuming!
Here is a brief description of the code:

# variable
# I specifies the range of the fit
mass   = RooRealVar("mass", "mass", 1780, 2000)

# these two histpdf are used to construct total pdf
dh_sigleak      = RooDataHist("dh_sigleak", "", mass, h_sigleak)
pdf_sigleak     = RooHistPdf("pdf_sigleak","",  mass, dh_sigleak, 2) # the kRed one
dh_kpietap = RooDataHist("dh_kpietap", "", mass, h_kpietap)
pdf_kpietap= RooHistPdf("pdf_kpietap", "", mass, dh_kpietap, 2) # the KGreen one

# total pdf
totpdf = RooAddPdf("totpdf","", RooArgList(pdf_sigleak, pdf_kpieta), RooArgList(n_sigleak, n_kpieta))
result = totpdf.fitTo(data, RooFit.NumCPU(6), RooFit.Save(1))
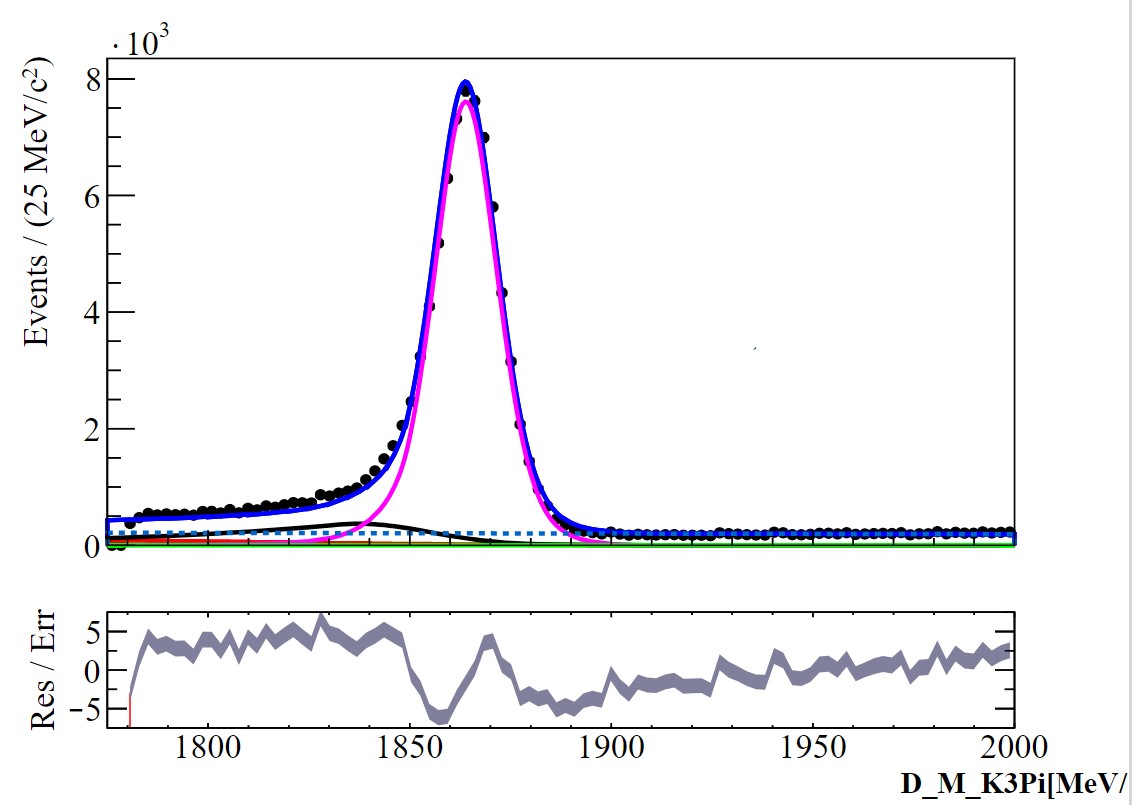
# the mass range[1780, 2000] is changed to [1775, 2000] automatically. 
# then the fit result looks like the mass range is also changed, which lead to a bad result.
# for now I dont know how to make the range get normal in the left bottom 
# time consuming process
[#1] INFO:NumericIntegration -- RooRealIntegral::init(pdf_sigleak_Int[D_M_K3pi]) using numeric integrator RooIntegrator1D to calculate Int(D_M_K3pi)
[#1] INFO:NumericIntegration -- RooRealIntegral::init(pdf_kpietap_Int[D_M_K3pi]) using numeric integrator RooIntegrator1D to calculate Int(D_M_K3pi)

Hello,

I think we need @moneta or @jonas here

Hi @realTay_John!

It’s true that analytic integration is not supported for the RooHistPdf with interpolation enabled when you don’t integrate over the full range.

I don’t understand why the PDF is not integrated over the full range in your example thought. You say that the “mass range[1780, 2000] is changed to [1775, 2000] automatically”, but that comes as a surprise to me because the number 1775 never appears anywhere in your example. That makes me think some info is missing to understand the problem. How do you create the RooHistPdfs? Do you maybe create them from histograms that have a different binning range (i.e. what is the binning of your input h_sigleak)? It would be good if you could provide a standalone reproducer for this problem, or at least clarify on the nature of the input histogram so I can try to build one.

Cheers,
Jonas

1 Like

Hi @jonas ,

Thanks for you answering!
Now I understand why the numerical integration would be used. And I also found where the RooHistPdf range is changed into [1775,2000]:

hk = TH1D("hk", "",  80, 1350.0, 2000.0)
h_sigleak = hk.Clone("h_sigleak")

tchain.Draw("D_M_K3pi>>h_sigleak",  "mass>1780.0", "goff")
dh_sigleak    = RooDataHist("dh_sigleak", "", mass, h_sigleak)
pdf_sigleak   = RooHistPdf("pdf_sigleak","",  mass, dh_sigleak, 2) # the kRed one
# Then the output is:
[#1] INFO:DataHandling -- RooDataHist::adjustBinning(dh_hsigleak): fit range of variable mass expanded to nearest bin boundaries: [1780,2000] --> [1775,2000]

I gauss the range of histogram h_sigleak is different from the range of mass, so I changed the range of h_sigleak by:


h_sigleak = TH1D("h_sigleak", "",  30, 1780.0, 2000.0)

tchain.Draw("D_M_K3pi>>h_sigleak",  "mass>1780.0", "goff")
dh_sigleak    = RooDataHist("dh_sigleak", "", mass, h_sigleak)
pdf_sigleak   = RooHistPdf("pdf_sigleak","",  mass, dh_sigleak, 2) # the kRed one
# Then the output is ok!!!

So I intend to construct fit model with a smaller range than the old histograms.

This topic was automatically closed 14 days after the last reply. New replies are no longer allowed.