Auto-Set axis range in THStack

hi
I am trying to auto-set a THStack axis range with something like

  [code]  

//hs refers to the THStack plot
TH1 *hlast = ((TH1 *)(hs->GetStack()->Last())); // the “SUM”
hlast->GetXaxis()->SetRange(hnn->FindFirstBinAbove(0),hnn->FindLastBinAbove(0));
hlast->SetFillColor(0);
hlast->SetLineColor(0);
hlast->Draw();
hs->GetXaxis()->SetTitle("");
hs->Draw(“same”);
[/code]

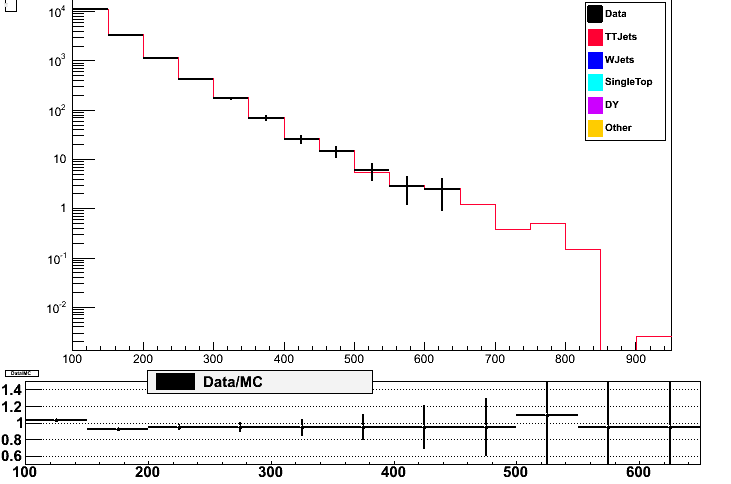
so practically, I am trying to plot the “SUM” of the THStack with “white” color, so to properly set the axis range, and then plot the THStack as well, but this fails giving the attached plot where the THStack is not properly shown… Any advice ?

Also, how could I force the top plot to have aligned margins with the bottom (ratio plot) one ?

Thanks in advance

Alex


What you are doing sounds a bit strange because the aim of the THSTack is precisely to set the proper axis for a set of histogram .

Can you provide a small running example an not just a part of your code ?

Well , the part of the THStack is really simple

first I create a THSTack like

THStack *hs = new THStack(hData->GetName(),hData->GetTitle());

then I add all background sources

 hs->Add(hTT);
 hs->Add(hWJets);
 hs->Add(hDY);
 hs->Add(hOther);

Cosmetics

[code] hs->SetMaximum(1.1*hh[1]->GetMaximum());
hs->SetMinimum(1);

[/code]

and then I take the “sum” and trying to set the axis range according to it

[code]
TH1 *hsum = ((TH1 *)(hs->GetStack()->Last())); // the “SUM”

    Int_t firstbin = hsum->FindFirstBinAbove(0);
    Int_t lastbin = hsum->FindLastBinAbove(0);
     hsum->GetXaxis()->SetRange(hsum->FindFirstBinAbove(0),hsum->FindLastBinAbove(0));
    hsum->SetFillColor(0);

    TPad *pad1 = new TPad("pad1","pad1",0,0.3,1,1);
    pad1->SetBottomMargin(0);
    pad1->Draw();
    pad1->cd();
    hsum->Draw();
    hs->Draw("sames");
    hData->Draw(same eP");  
   cout<<" for  "<<firstbin<<"  "<<lastbin<<endl;
   
    hs->GetXaxis()->SetTitle("");
    hs->GetXaxis()->SetTitleOffset(0.5);
    hs->GetYaxis()->SetTitleOffset(1);
    hs->GetYaxis()->SetTitle(nnn);
    hs->GetYaxis()->SetTitle(nnn);[/code]

So, drawing directly the THStack, results in a plot where the axis range are the “full” and not set according to hsum->FindFirstBinAbove(0),hsum->FindLastBinAbove(0) - What I do now, sets correctly the axis range but without plotting correctly the THStack on top - For simplicity, I dont put the code for the ratio, but this is trivial and anyway works as expected - is the top plot that I cannot get it to be displayed properly.

Thanks

Alex

Tanks for the explanation but I still believe a small running macro I can work with, would greatly improve the help I can give you.

Hi

Ok, I am uploading something - Look around line 230 -

Thanks in advance

Alex
Overlap.C (9.76 KB)

I would prefer something I can run.

root [0] 
Processing Overlap.C...
Data  .root
Error in <TFile::TFile>: file Data.root does not exist
Error in <TList::AddLast>: argument is a null pointer
Rare  .root
Error in <TFile::TFile>: file Rare.root does not exist
Error in <TList::AddLast>: argument is a null pointer
SingleTop  .root
Error in <TFile::TFile>: file SingleTop.root does not exist
Error in <TList::AddLast>: argument is a null pointer
WJets  .root
Error in <TFile::TFile>: file WJets.root does not exist
Error in <TList::AddLast>: argument is a null pointer
TT  .root
Error in <TFile::TFile>: file TT.root does not exist
Error in <TList::AddLast>: argument is a null pointer
	========================================================
	Target path: mergedDataplots.root:/
Error: illegal pointer to class object first_source 0x0 6  Overlap.C:82:
*** Interpreter error recovered ***
root [1] 

Please, find attached a collection of files - First rename the .txt to .tar.gz, untar and then simply run the Overlap.C

Regards

Alex

Thanks… Of course I would have expected something a bit simpler … It will just take a bit more time to answer you …

Ok … here is the simplified version I made from your example. Seems to me it is fine. Can you tell me me what you think is wrong there ?
Overlap.C (7.65 KB)

Hi

Thanks for your time on this ; So, although you do (like I did in my original code)

  [code]   
     hsum->SetFillColor(0);
     hsum->Draw();
     hs->Draw("sames");

[/code]
you get something like the attached plot, ie the “hs (=THStack)” is not drawn, just the hsum (the sum histo from the THStack)

Hope the problem is clear now

thanks

Alex


I just simplified your code and "I am"doing what you do … I will see …

The attached is ok. I think SAME instead of SAMES was the trick.
Overlap.C (7.22 KB)

Hi again

Indeed, this did the trick - But now a new problem appears - Look at the attached plot - The ticks in the axis have been stripped, looks like the THStack are drawn on top of the Canvas or something like this - Maybe this is a ROOT bug or something?

thanks again

–a

gPad->RedrawAxis();

Excellent! Thanks much!

–a