ROOT Version: 6.14
Platform: MacOS
Hello,
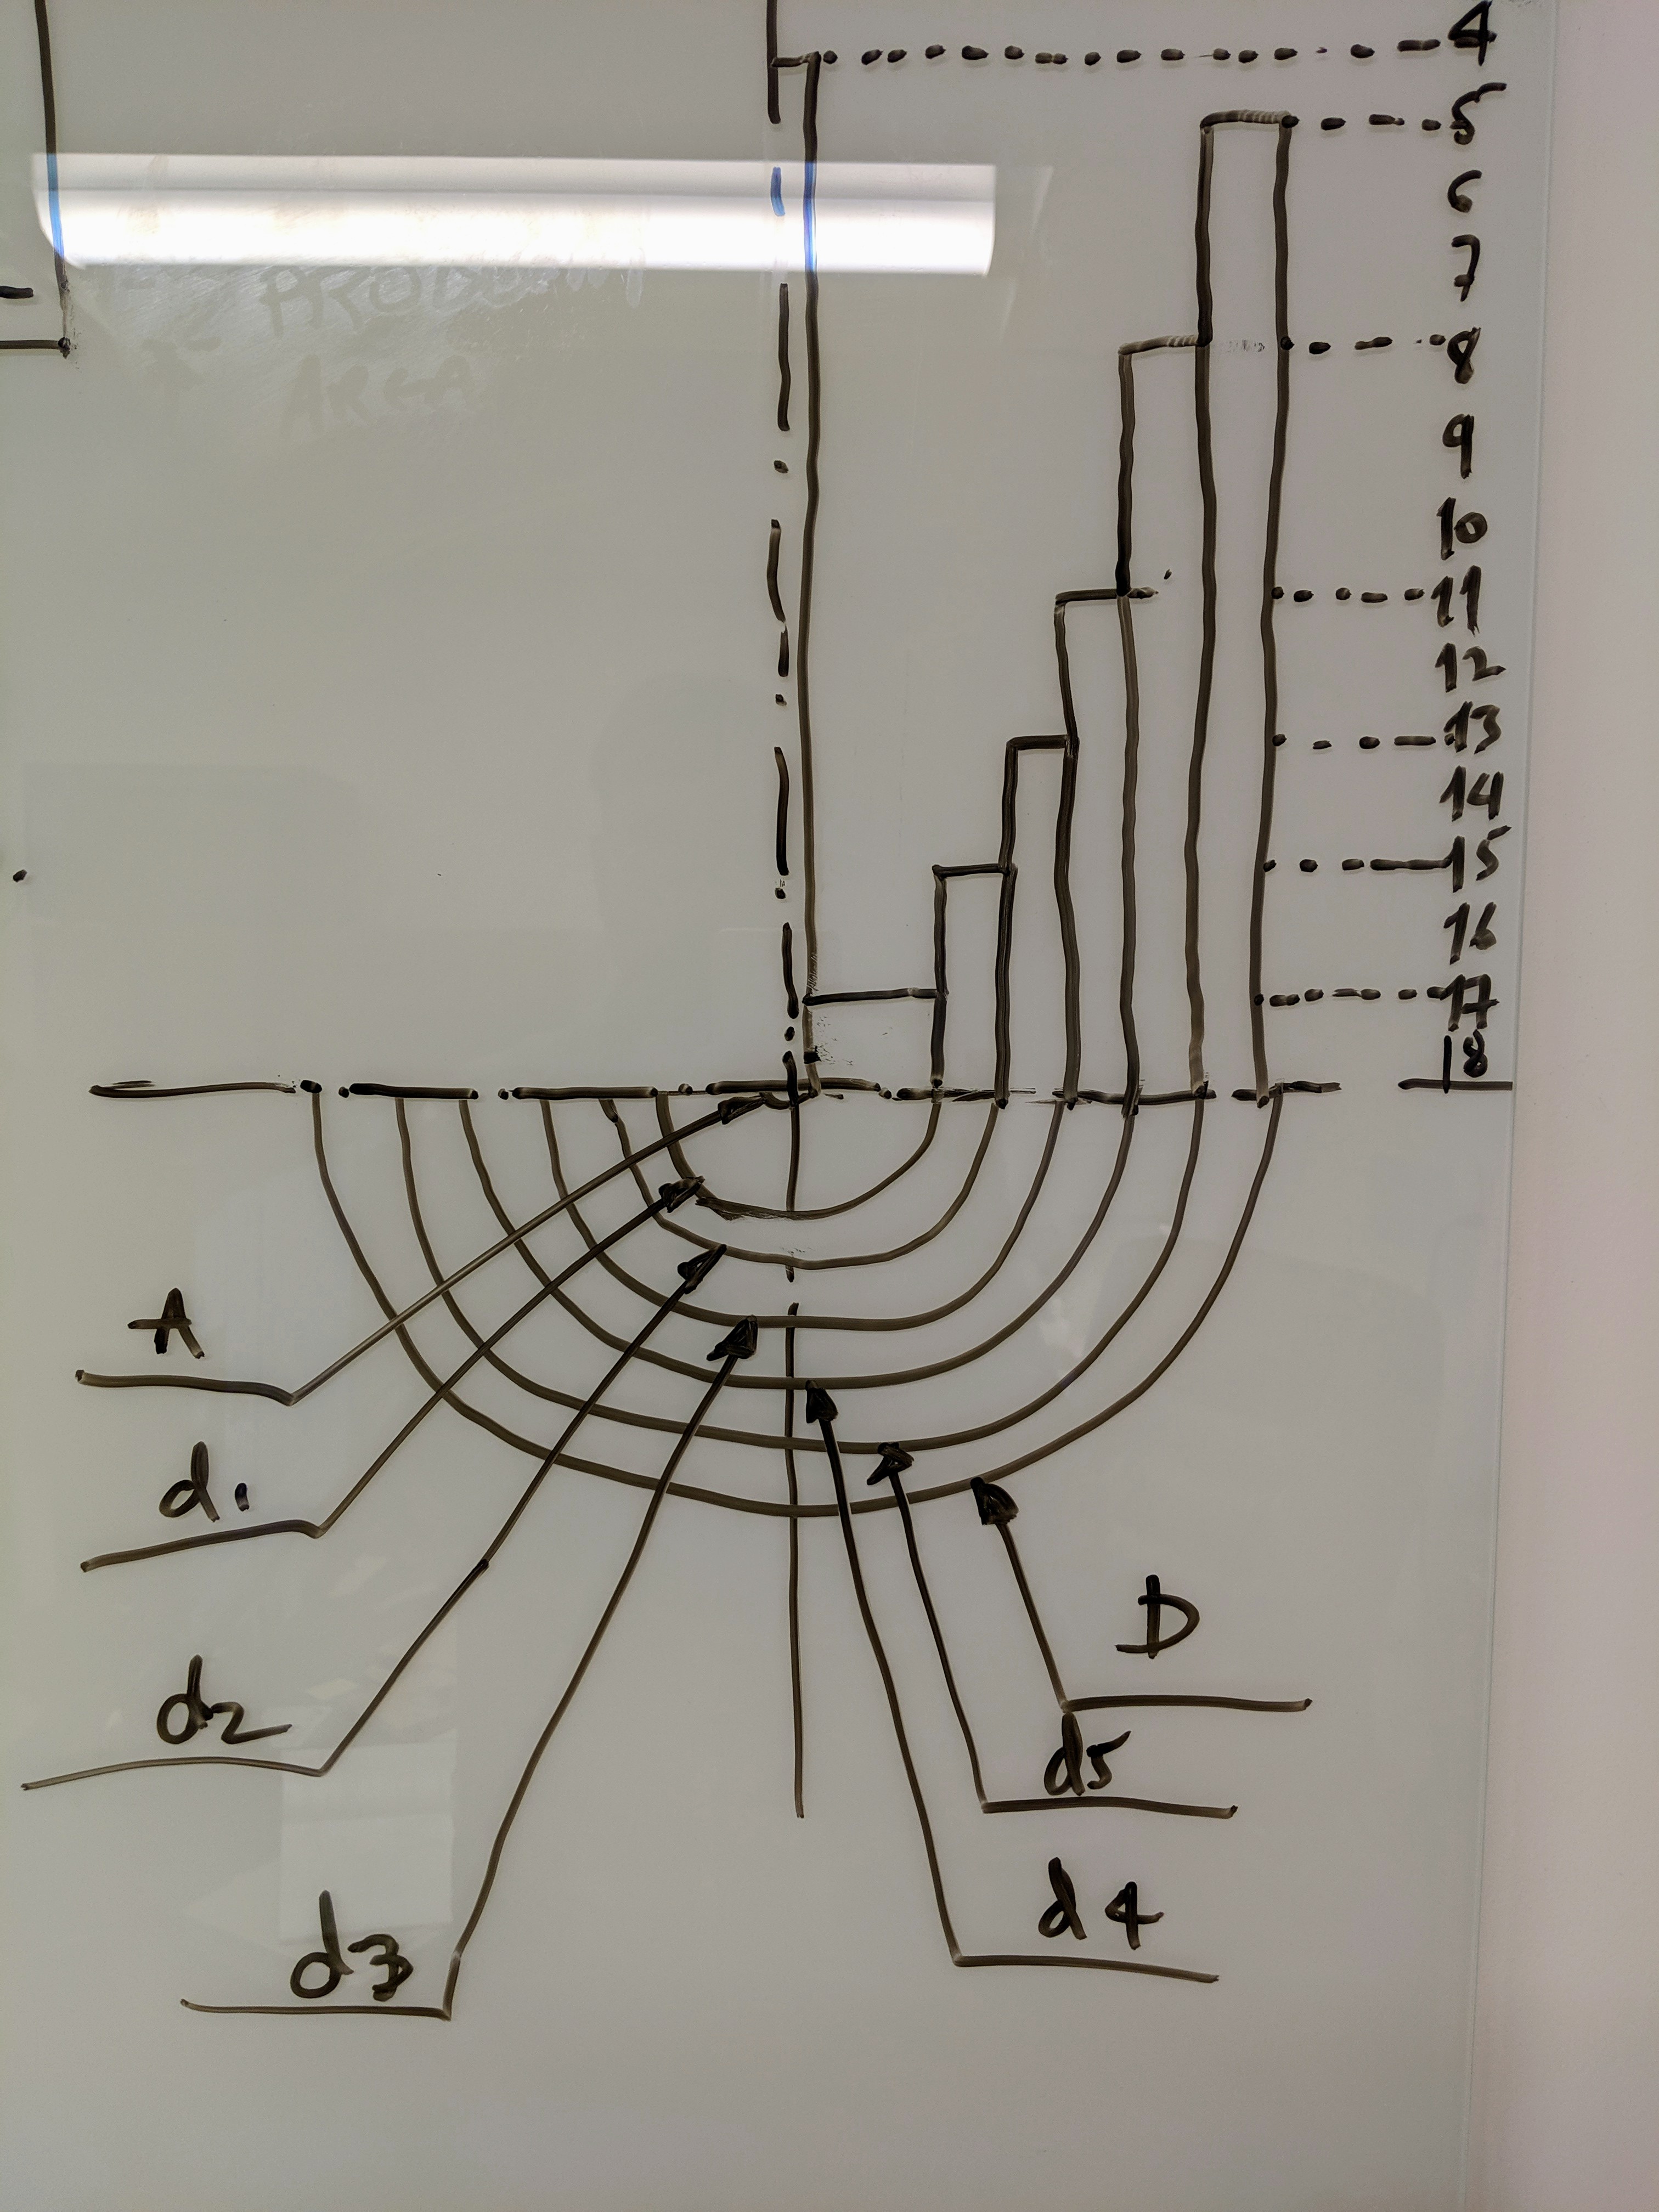
I am trying to add half circles to a bar plot, with width of each bar of a bar plot being different (something like the attached hand drawn figure). Is it possible to do in Root?
I searched for examples, but I did not find any. May be I am using wrong keywords. So I will appreciate any help pointing me to an example.
Thanks for your time,
A