I have the working code for a weighted 2D simultaneous PDF. It has 2 mass variables which I fit and two separate datasets corresponding to the D0 and D0bar samples. How do I get the asymmetry of as a function of the two mass variables from the D0 and D0bar PDFs corresponding to each mass variable.
I can do it for histograms using TH1::GetAsymmetry but I am not able to do it in the Roofit code.
Here’s the code that I am using:asym_proj_forum.zip (10.4 KB) and the root file is at the link:
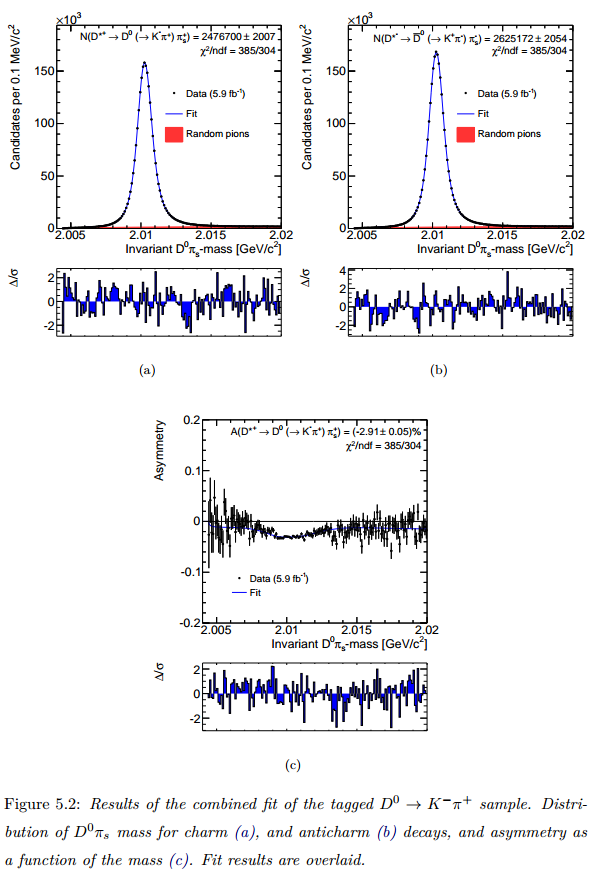
very nice fits you have there, and an interesting analysis! I should take your code as an example of 2D analysis numer numeric integrals that we should optimize to run faster, your script takes quite some time to run Also, the numeric integrals have a hard time converging, maybe we can do something about this. Is this kind of analysis you are doing common in your collaboration?
As for the actual question: is there a reason why this wouldn’t work with a RooFormulaVar?
Thank you @Jonas. I think such analyses are common in any experimental high energy physics collaborations.
It looks there is a way if doing it using arguments in RooSimultaneous. One can search “Asymmetry” in ROOT: RooSimultaneous Class Reference. am tryin to include the argument like: simPdf.plotOn(kk_d0,Slice(sample,"D0"),Components(RooArgSet(model_d0)),ProjWData(sample,combData),Name("model_d0"), Asymmetry(sample));, but I am not able to get what I want. I want to have something like:
I have some suggestions to massively speed up your script, in case this is helpful:
in fitTo(), use our new , EvalBackend("cpu") (or BatchMode(true), as it was called prior to ROOT 6.30) See also the documentation for RooAbsPdf::fitTo()
Restrict your RooDstD0BG parameter ranges a bit, such that you don’t get inf integrals:
When I try to plot the asymmetry, I get this error:
[#0] ERROR:Plotting -- RooAbsReal::plotAsymOn(simPdf) function doesn't depend on asymmetry category sample
I suspect the Asymmetry() command doesn’t play well with the ProjWData(), which you of course need to get the 1D plots I will try to reproduce this problem in a simple toy macro and then go on fixing it.
Then you can have simPdf.plotOn(kk_d0,Slice(sample,"D0"),Components(RooArgSet(model_d0)),ProjWData(sample,combData),Name("model_d0"), Asymmetry(sample));
The code will run with this, but I don’t get the asymmetry plots as I have shown as an example.
[#1] INFO:Plotting -- RooSimultaneous::plotOn(simPdf) plot on x_A represents a slice in the index category (sample)
[#0] ERROR:Plotting -- RooAbsReal::plotAsymOn(pdf_A) function doesn't depend on asymmetry category sample
If you want us to fix this, can you please open a GitHub issue that includes my reproducer? It’s better if you open the issue instead of me, because if a user opens an issue instead of a dev, it’s clear that this is a priority. That helps with the planning.
Dear @jonas, is there a way to get a TH1D histogram corresponding to the PDFs that are used for the fit. If yes, the, one can find the asymmetry between the two ?