Hi, I find out one error in my range definition. Now the plots of data are reasonable, but the pdf is not.
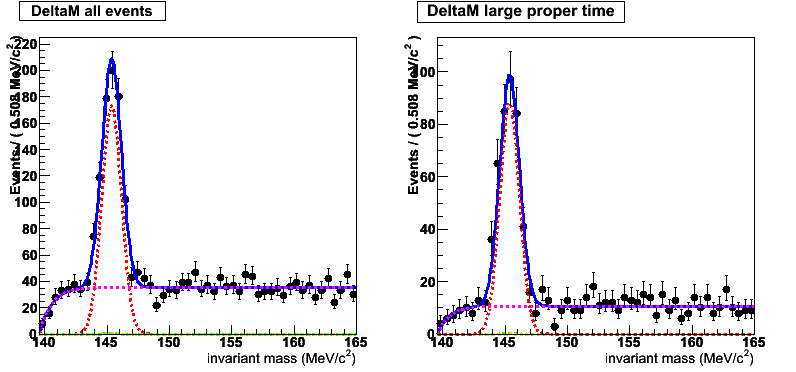
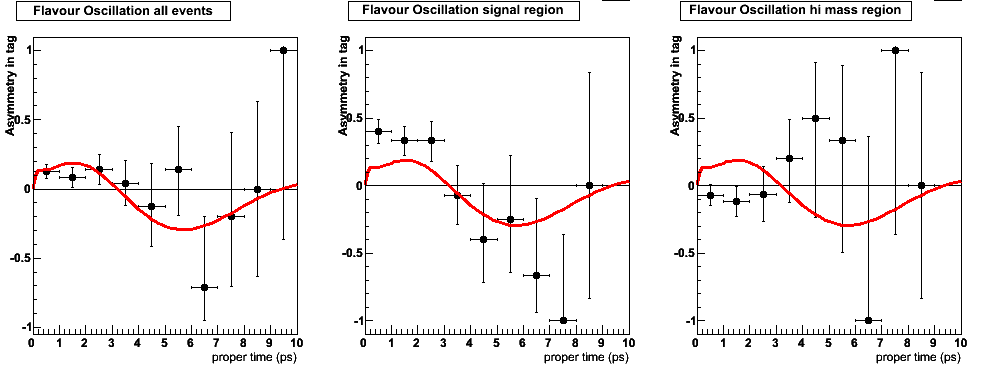
In particular, generating some data with signal+background, where the signal has a time dependent asymmetry (B0 oscillation) for events peaking in the mass distribution, while the background doesn’t and has a flat distribution.
I would expect that the data and the pdf show a time dependent oscillation for events classified as “TaggedSignal”, while are more flat for the events classified as “TaggedHimass”.
Data are like this, but the pdf is exactly the same. See the attached plots.
Now the code is:
RooCategory *tag = new RooCategory(“tag”,“B flavour”);
tag->defineType(“unmix”,+1);
tag->defineType(“mix”,-1);
tag->defineType(“untag”,0);
tag->setRange(“TaggedSignal”,“mix,unmix”); m->setRange(“TaggedSignal”,143.,147. ;
;
tag->setRange(“TaggedAll”,“mix,unmix”);
tag->setRange(“TaggedHimass”,“mix,unmix”); m->setRange(“TaggedHimass”,mDD+3.,m->getMax());
…
c->cd(1);
p20 = t->frame(Bins(nBin/5),Title(“Flavour Oscillation all events”));
dataFIT->plotOn(p20,Asymmetry(*tag),CutRange(“TaggedAll”));
pdf->plotOn(p20,Asymmetry(*tag),ProjectionRange(“TaggedAll”));
p20->Draw();
c->cd(2);
p25 = t->frame(Bins(nBin/5),Title("Flavour Oscillation signal region"));
dataFIT->plotOn(p25,Asymmetry(*tag),CutRange("TaggedSignal"));
pdf->plotOn(p25,Asymmetry(*tag),ProjectionRange("TaggedSignal"));
p25->Draw();

c->cd(3);
p26 = t->frame(Bins(nBin/5),Title("Flavour Oscillation hi mass region"));
dataFIT->plotOn(p26,Asymmetry(*tag),CutRange("TaggedHimass"));
pdf->plotOn(p26,Asymmetry(*tag),ProjectionRange("TaggedHimass"));
p26->Draw();
Could you suggest me the proper way to plot the asymmetry plot of the pdf in a range ?
many thanks
Stefania Vecchi