Hello, @MassimilianoAntonell !
It seems you want to somehow describe the shape of your histogram, like with a skewed normal distribution. For what parameter exactly do you want to get asymmetric errors?
Since I won’t be able to answer quickly, I’ll give my opinion for now.
I guess that you might not need asymmetric error estimation actually.
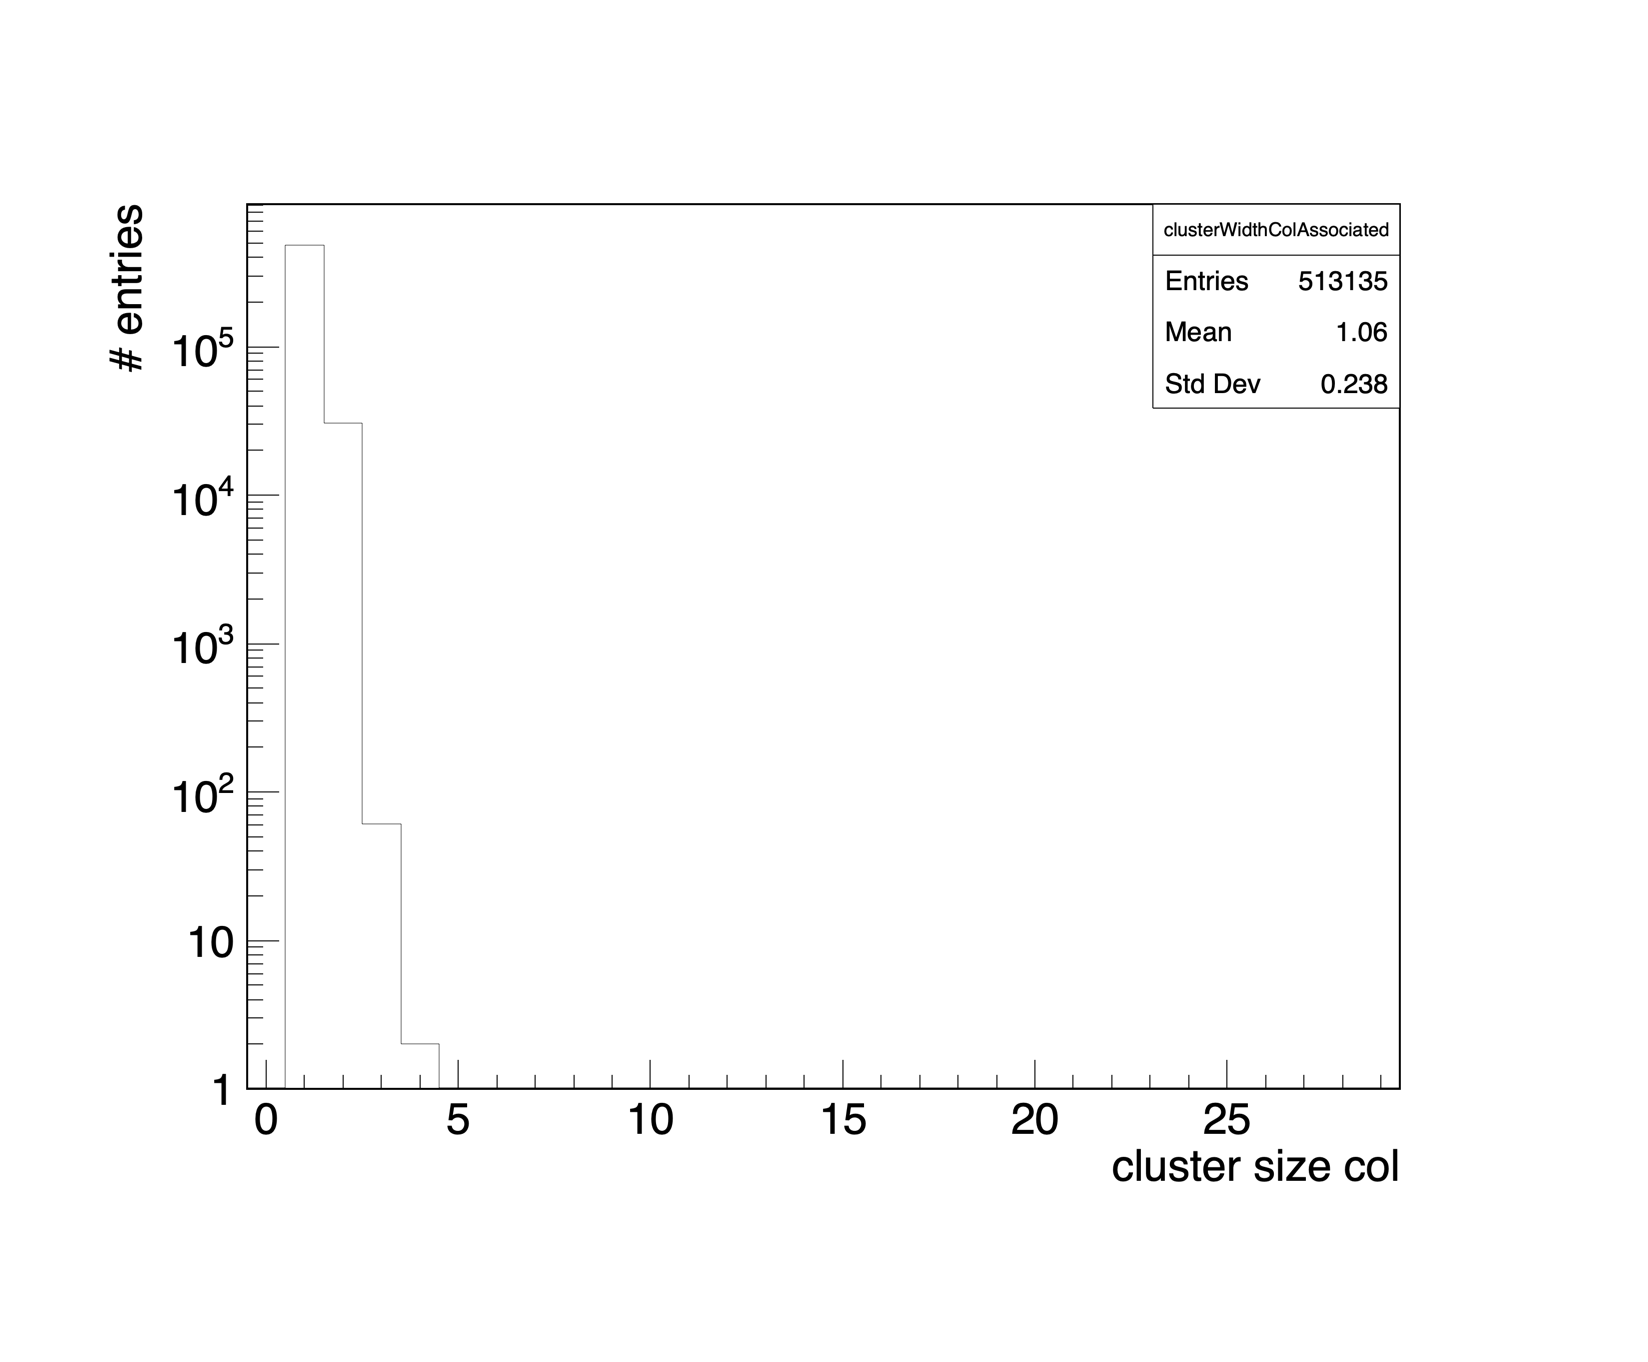
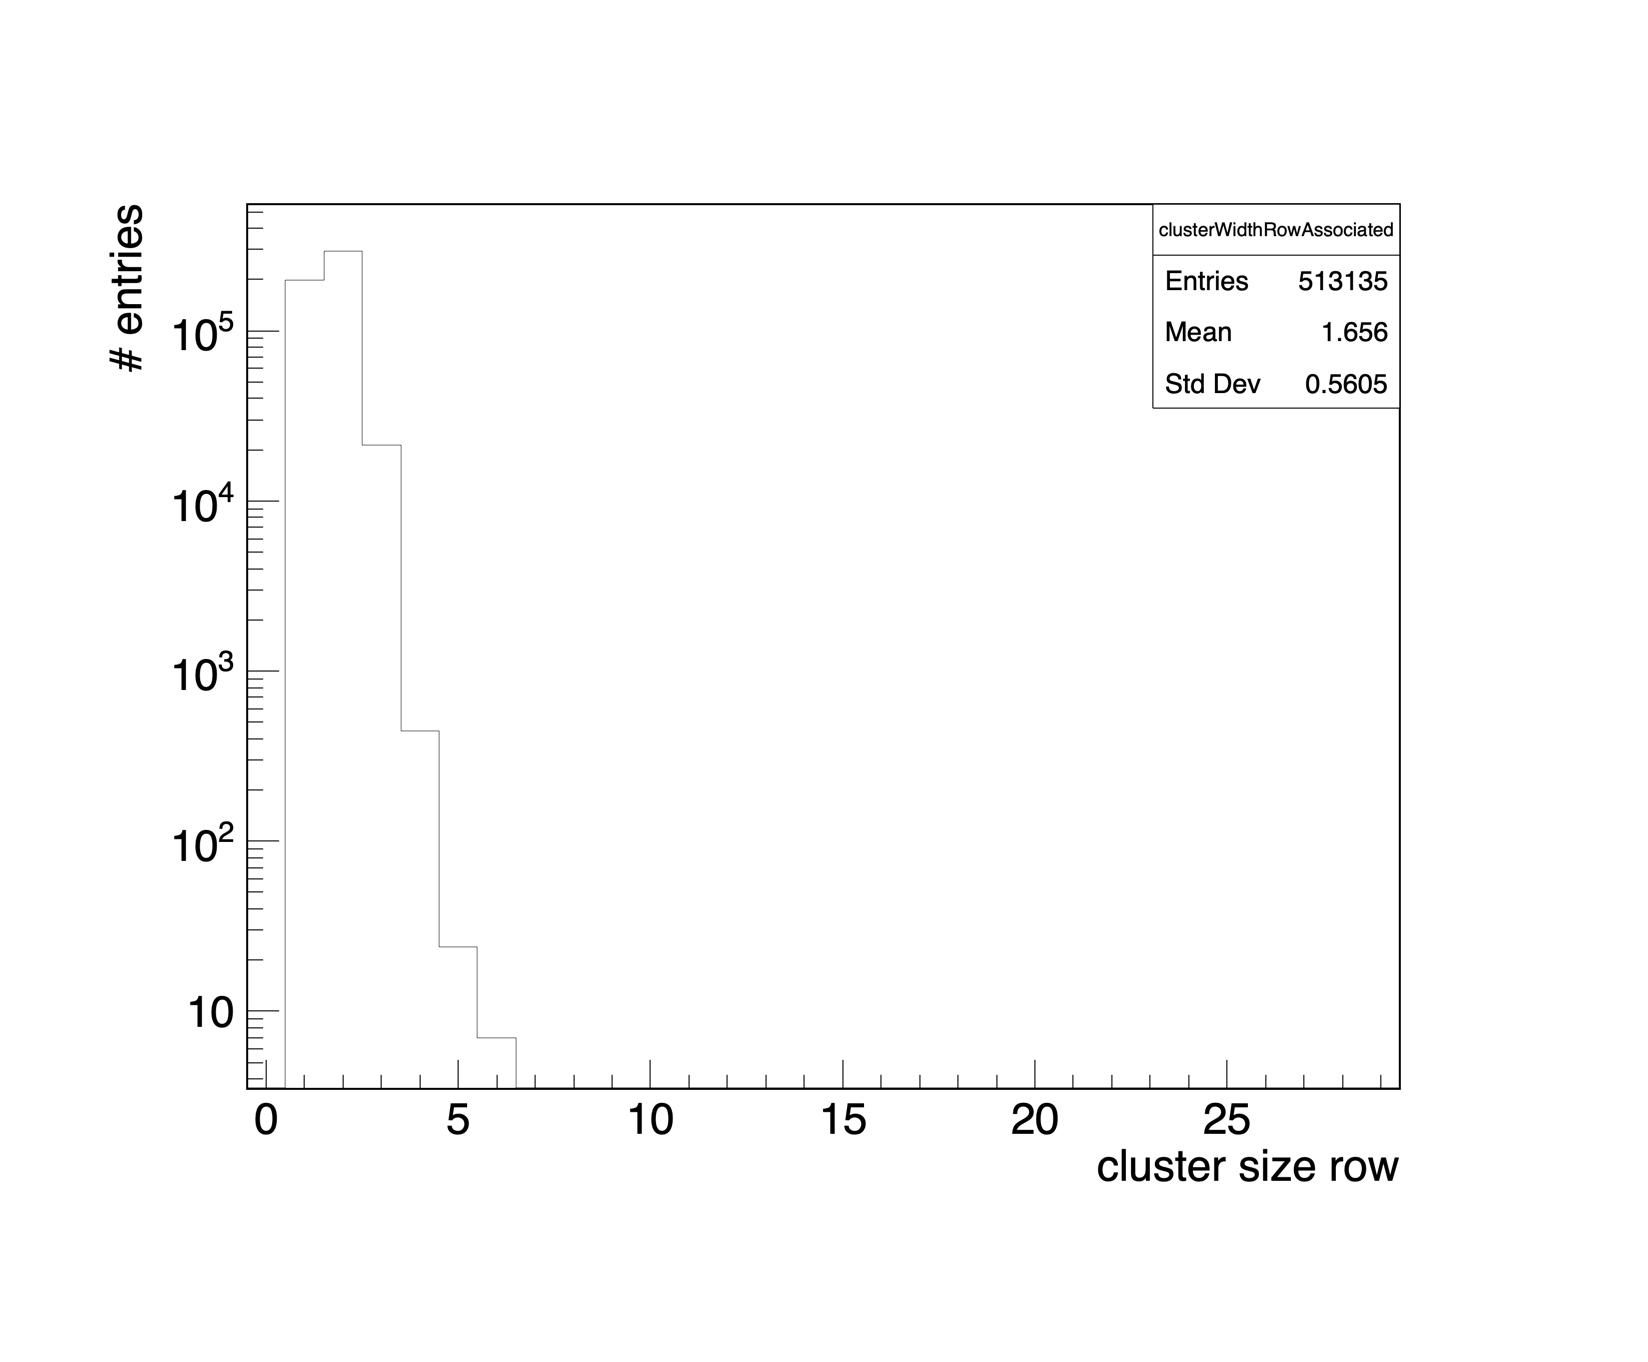
At first glance, you would probably want to check if the number of rows/columns follows a Poisson distribution using a fit. In this case, you will get symmetric errors in estimating the average number of rows/columns from the fitting, which should be valid due to the size of the event sample.
Here is a simple example, slightly adapted for your request:
// PoisFit.cpp

#include "TH1.h"
#include "TF1.h"
#include "TCanvas.h"
#include "TRandom.h"

void PoisFit() {
    // Create a histogram
    // have to shift bin edges because fitter takes function value from bin center
    // so one should keep values of discrete pdf in bin center
    double xLow = 0 - 0.5;
    double xHigh = 10 - 0.5;
    int nbins = xHigh - xLow; // right edge of the bin is excluded
    TH1D *h = new TH1D("h", "Histogram", nbins, xLow, xHigh);

    // Fill the histogram with random numbers following a Poisson distribution
    for (int i = 0; i < 1000; ++i) {
        h->Fill(gRandom->Poisson(1.0) + 1);
    }

    // Define a Poisson function for fitting, shift it to start from 1
    TF1 *fpois = new TF1("fpois", "[0]*TMath::Poisson(x - 1,[1])", xLow, xHigh);
    fpois->SetParameters(1, 1.0); // initial values for parameters
    fpois->SetParName(0, "nEvents");
    fpois->SetParName(1, "mean");

    // "L" option to use log-likelihood because bin content represents counts
    // "S" to save fit result, "Q" to suppress printing extra information
    TFitResultPtr fitRes = h->Fit("fpois", "LSQ");
    fitRes->Print();

    // Draw the histogram and the fitted function
    TCanvas *c1 = new TCanvas("c1", "c1", 800, 600);
    h->Draw();
    fpois->Draw("same");
}
In case you want to obtain asymmetric errors of mean estimate, you can use "E" option, which will enable MINOS [ROOT: TH1 Class Reference].
However, if your data does not follow a Poisson distribution, you will see it from the fit results. In that case you will have to conduct further research and propose a better model.
P. S.: A simple option is to calculate the skewness of the sample if that is sufficient.