_ROOT Version: 6.22/08
_Platform: macosx64 Compiler: Not Provided
I have experiment names with corresponding experimental numerical result.
I want to have experiment names on X axis and their values on Y.
I can plot it using TGraph, but I dont know how to change x value labels to experiment names.
    int x[arrSize];
    int y[arrSize];
    for (int i = 0; i < arrSize; i++) {
        x[i] = i;
        y[i] = dataBase[i]; // some value from the experiment
    }

    auto gr = new TGraph(arrSize, x, y);
    gr->SetLineWidth(3);
    gr->SetMarkerStyle(21);
    gr->SetMarkerSize(0.5);
    gr->SetLineColor(2);
    gr->Draw();
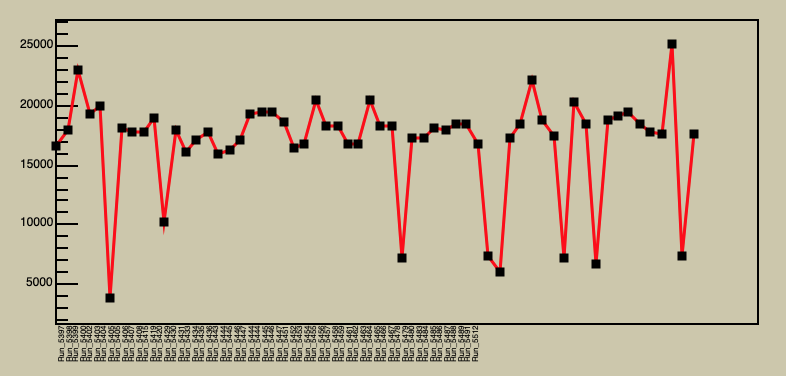
So, this way I can see the result and how it is changing, but I want to add some names/labels on X axis: e.g. experiment 41, experiment 55 etc.
Experiments which I am plotting are filtered, so numbers are not consecutive and I really need to show which experiments I am talking
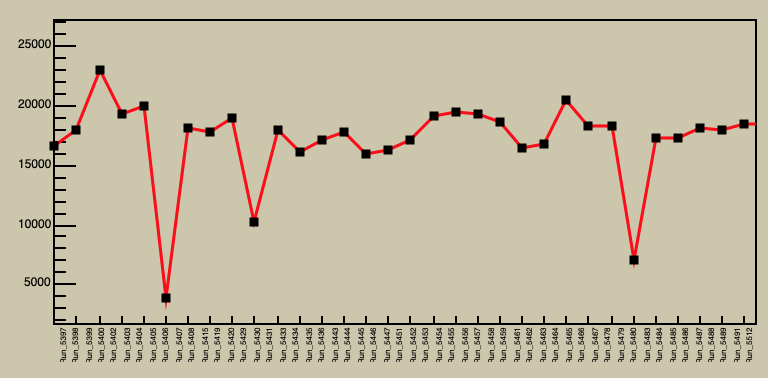
It works, but there is 1 problem:
Labels are not below the point - they are “stick together” and doesn’t even cover the whole x axis.
Here is the changed code
    int x[arrSize];
    int y[arrSize];
    for (int i = 0; i < arrSize; i++) {
        x[i] = i;
        y[i] = dataBase[i]; // some value from the experiment
    }

    auto gr = new TGraph(arrSize, x, y);

    for (int i = 1; i <= arrSize; i++) {
        gr->GetXaxis()->SetBinLabel(i, experimentNamesInDatabase[i-1].c_str());
    }

    gr->SetLineWidth(3);
    gr->SetMarkerStyle(21);
    gr->SetMarkerSize(0.5);
    gr->SetLineColor(2);
    gr->Draw();