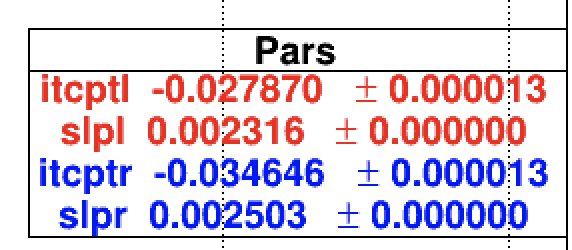
I have a TPaveStats object in which the fitting results of two graphs were added in different colors, now the problem is the parameters are all aligned in the middle of their rows, may I ask is it possible to force them to be left aligned?
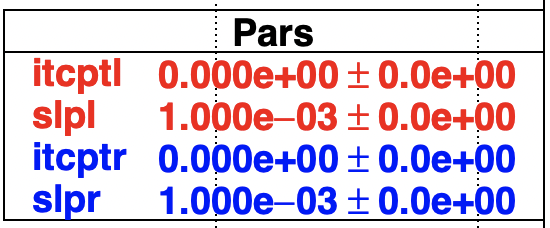
Thank you so much Olivier. But may I ask why, you changed colon sign(: ) to equals sign(=), then the problem solved, and the equals sign actually does not present in the drawing.
That’s an internal feature of TPaveStats, used to draw stats for histograms. It allows to align left the parameter name and align right the parameter value.