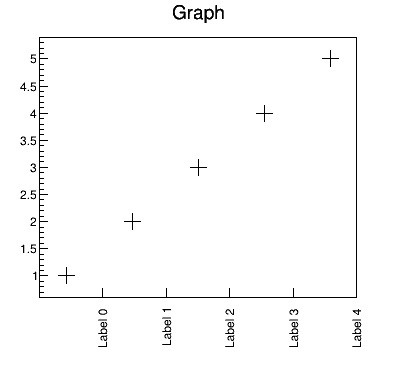
I am trying to set custom labels to my bins in TGraph. I figured out that I must use the ChangeLabel method on the axis. I also set Ndivisions so that the number of ticks correspond to the number of bins that I have. However, the ticks are not aligned with the bins.
Reproducible example:
import ROOT
import numpy as np

canvas = ROOT.TCanvas(f"test_canvas", "title", 400, 400)
canvas.SetBottomMargin(0.2)
canvas.Draw()
canvas.cd()

num_values = 5

g = ROOT.TGraph(num_values,
                      np.arange(num_values, dtype='float') + 1,
                      np.arange(num_values, dtype='float') + 1)
g.SetMarkerSize(2)
g.SetMarkerStyle(2)

xaxis = g.GetXaxis()
xaxis.SetNdivisions(-(num_values + 0))
xaxis.ChangeLabel(1, -1, -1, -1, -1, -1, " ")

labels=[f'Label {i}' for i in range(num_values)]

for i, label in enumerate(labels):
    xaxis.ChangeLabel(i + 2, 90, -1, 32, -1, -1, label)

g.DrawClone('AP')
Result:
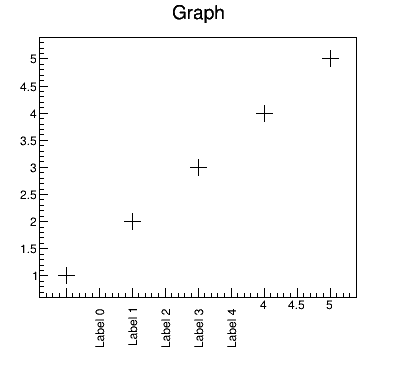
If I don’t use the Ndivisions, I get the following result instead:
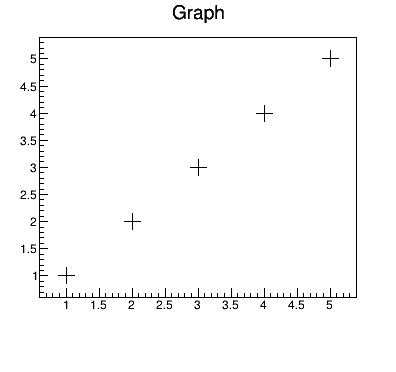
For completeness, without setting the custom labels, the graph looks like this:
How can I achieve the result as shown in the first image but with the labels aligned with the bins?
Thank you for your answer. If I understand the macro you referenced correctly, I have to draw the labels myself using TLatex and draw the grid lines manually using TLine?
It seems to me that a functionality for setting labels to bins of a histogram should be available out of the box. What is your take on this?
TGraphs are not binned; when they are drawn, an ‘empty’ histogram (with 100 bins in x, if I’m not mistaken) is used for the axes, etc.; therefore the bin numbers do not match the actual TGraph point numbers.
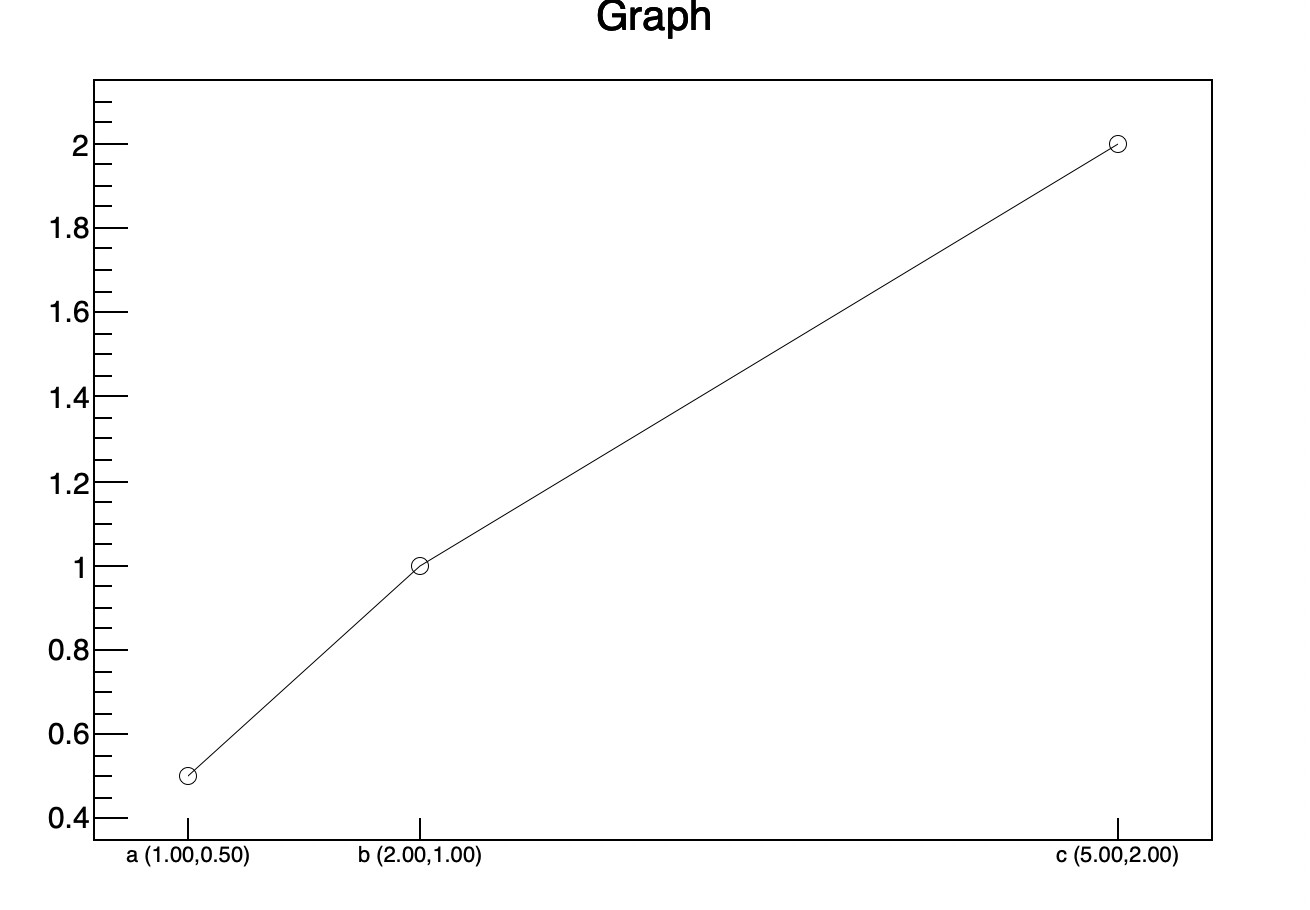
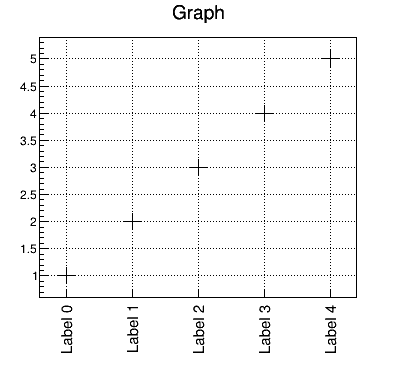
Thank you both. Using the examples you provided, I was able to do produce exactly what I wanted.
I am marking this post as the answer as it contains the full answer together with the code.
Note that I also had to use canvas.SetGrid(0) to display grid on the y-axis. The existing ticks and labels are made invisible. Then, the labels in question are drawn for each point.
import ROOT
import numpy as np

canvas = ROOT.TCanvas(f"test_canvas", "title", 400, 400)
canvas.SetBottomMargin(0.2)
canvas.Draw()
canvas.cd()

# This is important for displaying the grid lines on y-axis.
canvas.SetGrid(0)

num_values = 5

g = ROOT.TGraph(num_values,
                      np.arange(num_values, dtype='float') + 1,
                      np.arange(num_values, dtype='float') + 1)
g.SetMarkerSize(2)
g.SetMarkerStyle(2)

# Make existing x-axis labels and ticks invisible
g.GetXaxis().SetTickLength(0)
g.GetXaxis().SetLabelSize(0)
g.DrawClone('AP')

# All of the following code sets custom x-axis labels
ymin = g.GetHistogram().GetMinimum()
ymax = g.GetHistogram().GetMaximum()
dy = (ymax - ymin)

n = g.GetN()
for i in range(n):
    x = g.GetPointX(i)
    y = g.GetPointY(i)

    # Draw label
    t = ROOT.TLatex(x + 0.02 * num_values, ymin - 0.12 * dy, ROOT.Form(f"Label {i}"))
    t.SetTextAngle(90)
    t.SetTextSize(0.045)
    t.SetTextFont(42)
    t.SetTextAlign(21)
    t.DrawClone()

    # Draw tick
    tick = ROOT.TLine(x, ymin, x, ymin + 0.03 * dy)
    tick.DrawClone()

    # Draw grid line for x-axis
    grid = ROOT.TLine(x, ymin, x, ymax)
    grid.SetLineStyle(3)
    grid.DrawClone()
Note that your example is losing the power of TExec which allows a much more interactive and dynamic version of this example. With the example I sent you, you can for instance move interactively the graph’s points and the labels will automatically follow. But you can get it only if you are using C++ … you are using python …