Hi everyone, I am plotting a couple of TH2D histograms on the same canvas, but I am having some lay-out problems:
-
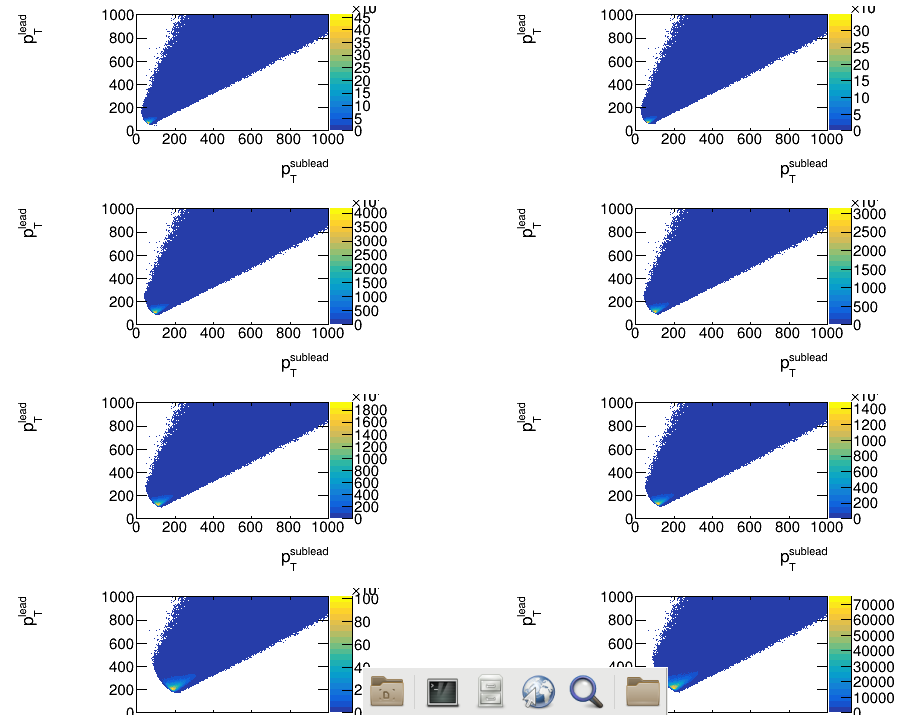
I had to change my margins so that my axis titles would show, but now there is too much space between my y-axis title and axis itself, I’d like to change this, but I don’t know how to.
-
I am plotting my graphs with Draw(“COLZ”) and so I get a colour palette. For some plots, however, my labels are shown as 70000, 60000, 50000 etc, and I was wondering if I could change this so that it would write it as 70, 60, 50 etc with a x10^3 at the top of the palette (it does this for some of my plots automatically, but not for all).
Thanks a lot!
void twoD_method2(){
  auto f = new TFile ("HaddOutput_2D_method2.root");
  TCanvas *c = new TCanvas("c", "", 1000, 800);
  c->Divide(2, 4);

  std::vector<double> yCut = {0.3, 0.6};
  std::vector<int> mjj_threeCut = {132, 205, 235, 318, 394};
  std::vector<int> mjj_sixCut = {141, 215, 247, 335, 414};

  int n1 = yCut.size();
  int n2 = mjj_threeCut.size();

  TH2D *h1[n1];
  TH2D *h2[n1][n2];
  TH2D *h3[n1][n2];

  for (int i =0; i<n1; i++) {
    f->GetObject(TString::Format("AfterCuts/yCut_%.1f/mjjCut_0/2Dleadsubleadpt", yCut[i]), h1[i]);
    if (i==0) {
      for (int j=0; j<n2; j++) {
	c->cd(2*j+1);
	f->GetObject(TString::Format("AfterCuts/yCut_%.1f/mjjCut_%d/2Dleadsubleadpt", yCut[i], mjj_threeCut[j]), h2[i][j]);
	h2[i][j]->Draw("COLZ");
        h2[i][j]->GetXaxis()->SetNdivisions(5);
        h2[i][j]->GetYaxis()->SetNdivisions(5);
	h2[i][j]->GetYaxis()->SetLabelSize(0.09);
        h2[i][j]->GetXaxis()->SetLabelSize(0.09);
	h2[i][j]->GetXaxis()->SetTitle("p_{T}^{sublead}");
        h2[i][j]->GetYaxis()->SetTitle("p_{T}^{lead}");
	h2[i][j]->GetYaxis()->SetTitleSize(0.1);
        h2[i][j]->GetXaxis()->SetTitleSize(0.1);
	gPad->SetBottomMargin(0.3);
	gPad->SetRightMargin(0.3);
        gPad->SetLeftMargin(0.3);
	gPad->SetTopMargin(0.05);
      }
    }

    else if (i==1) {
      for (int k=0; k<n2; k++) {
	c->cd(2*k+2);
	f->GetObject(TString::Format("AfterCuts/yCut_%.1f/mjjCut_%d/2Dleadsubleadpt", yCut[i], mjj_sixCut[k]), h3[i][k]);
	h3[i][k]->Draw("COLZ");
	h3[i][k]->GetXaxis()->SetNdivisions(5);
        h3[i][k]->GetYaxis()->SetNdivisions(5);
	h3[i][k]->GetYaxis()->SetLabelSize(0.09);
        h3[i][k]->GetXaxis()->SetLabelSize(0.09);
	h3[i][k]->GetXaxis()->SetTitle("p_{T}^{sublead}");
        h3[i][k]->GetYaxis()->SetTitle("p_{T}^{lead}");
	h3[i][k]->GetYaxis()->SetTitleSize(0.1);
        h3[i][k]->GetXaxis()->SetTitleSize(0.1);
        gPad->SetBottomMargin(0.3);
        gPad->SetRightMargin(0.3);
        gPad->SetLeftMargin(0.3);
	gPad->SetTopMargin(0.05);
        h3[i][k]->GetZaxis()->SetLabelFont(21);

      }
    }
  }
}