Adjusting number of labels along the custom linear axis

Dear experts,

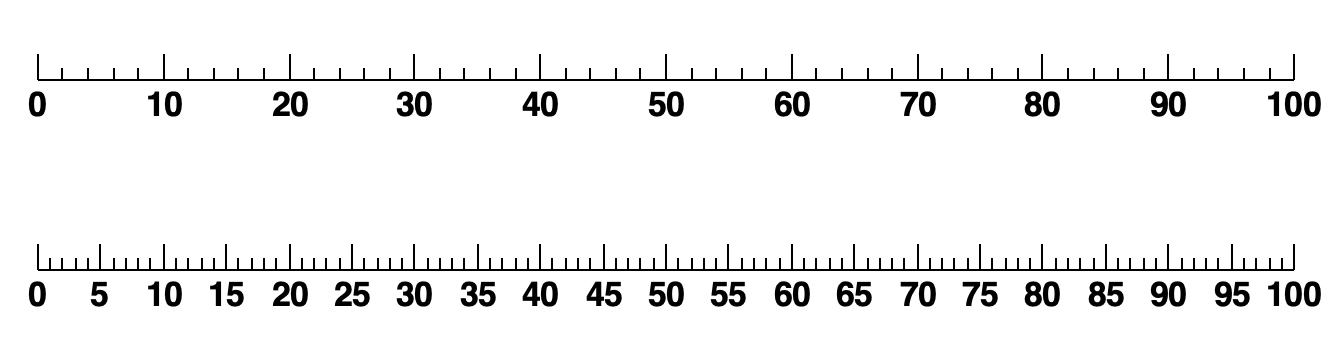
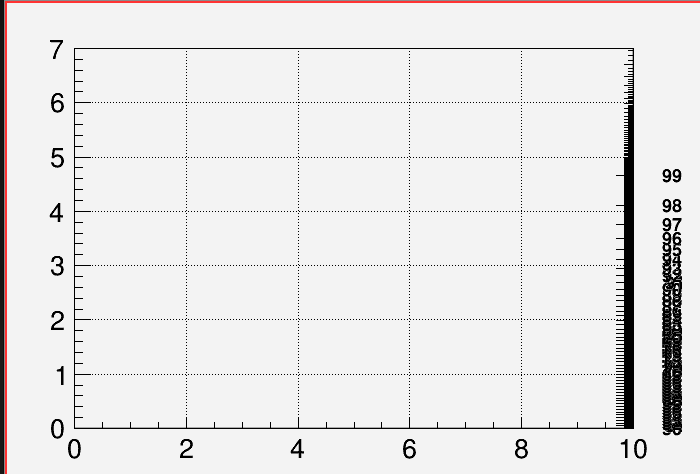
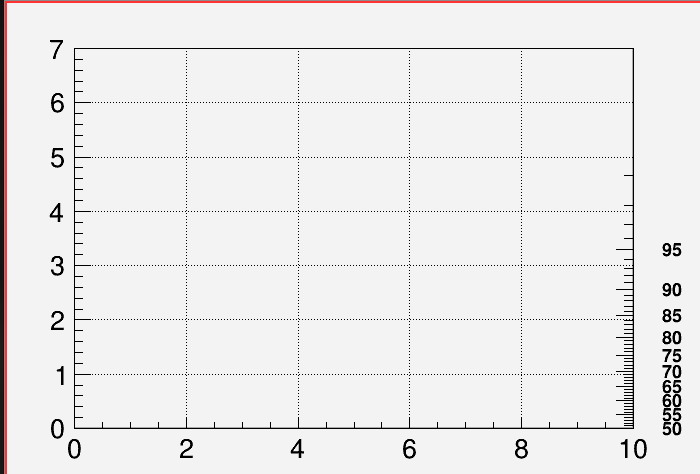
I have created my second custom axis.
I want to create more fine labels at the top (99.1, 99.2, 99.3, 99.4, …) and avoid pollution at the bottom (50, 60, 70, …)

I have tried using SetNDivisions(), SetMaxDigits(), SetDecimals(), and even ChangeLabelByValue() for two days in a row and have not been able to achieve what I wanted.

Is there any way to achieve that? Is it possible at all?
Could somebody give me a hint or, at best, reproducible?

I appreciate any help.

Here is the reproducible:

#!/usr/bin/env python3
import ROOT

ROOT.gStyle.Reset()

canvas = ROOT.TCanvas()
canvas.SetGridx()
canvas.SetGridy()
canvas.DrawFrame(0.,0.,10.,7.)
x_pos = canvas.GetUxmax()

def convert_axis1_to_axis2(x):
    '''Return axis2 value given axis1'''
    return 100.*ROOT.Math.gaussian_cdf(0.5*x)

for i in range(8):
    print(f"Value {i:.2f} on axis1 should correspond to value {convert_axis1_to_axis2(i):.2f} on axis2!")

y_min = convert_axis1_to_axis2(canvas.GetUymin())
y_max = convert_axis1_to_axis2(canvas.GetUymax())

f1= ROOT.TF1("f1","2*ROOT::Math::gaussian_quantile_c(1-x/100., 1)",y_min,y_max)
axis =  ROOT.TGaxis(x_pos, canvas.GetUymin(), x_pos-0.001, canvas.GetUymax(),"f1")
axis.SetLabelOffset(-0.07)
axis.DrawClone()
canvas.Modified()
canvas.Update()
input("wait")

cheers,
Bohdan

For TAxis you can use SetBinLabel to define each bin’s label as you want (empty, any number, text, etc).
For a TGaxis, it’s ChangeLabel.

I have tried the ChangeLabel as well as ChangeLabelByValue.
There are no labels above 95 (above 99 if I tweak SetNdivisions()) from the start.

What should I supply as the first argument?

If it worked for you, could you add a single line to my reproducible to show how to use ChangeLabel to add any label with a single decimal after the comma, e.g., 99.8?

you should change the number of divisions:

{
   TCanvas *c1 = new TCanvas("c1","Examples of TGaxis",10,10,700,500);
   c1->Range(-10,-1,10,1);

   TGaxis *axis1 = new TGaxis(-9,0.2,9.,0.2,0.,100,510,"");
   axis1->Draw();

   TGaxis *axis2 = new TGaxis(-9,-0.2,9.,-0.2,0.,100,520,"");
   axis2->Draw();
}

@couet,

I have tried

axis =  ROOT.TGaxis(x_pos, canvas.GetUymin(), x_pos-0.001, canvas.GetUymax(),"f1", 99999)

I still do not get any values above 99, and the right axis above axis=5 is empty.
I would like to have, for example, 99.38, which should be approximately where axis1=5, 99.87 where axis1=6, and 99.98 around axis1=7.
Not precisely at the old axis values, but 99.1, 99.2, and 99.3, so the labels are visible.

Ideally, I would like, in principle, to have a tool to make this plot up to axis1=10 (axis2=99.999971).

Oh I see , you are using an axis labeled using a function. This kind of axis cannot be tuned as easily as the other axis. They are very primitive in that respect. I am afraid there not much you can do.

1 Like

Is it possible to make such a function axis logarithmic but make it act like 100 is a new 0 and go down?
For example, the usual log axis would have labels at 0.01, 0.1, 1, 10, 100.
Can one create a modified log axis such that it has labels at 99.99, 99.9, 99, 90, and 50?
And additionally enforce the formula, so the labels are spread accordingly as in my example above?

I am not sure it makes real sense … but try this;

{
   auto c1 = new TCanvas("c1","Examples of TGaxis",10,10,700,500);
   c1->Range(-10,-1,10,1);
   
   TGaxis *a = new TGaxis(-9,0.2,9.,0.2,1,10,510,"GS");
   a->SetLabelSize(0.025);
   a->SetMoreLogLabels();
   a->Draw();
   a->ChangeLabel(1,-1,-1,-1,-1,-1," ");
   a->ChangeLabel(2,-1,-1,-1,-1,-1," ");
   a->ChangeLabel(3,-1,-1,-1,-1,-1," ");
   a->ChangeLabel(4,-1,-1,-1,-1,-1," ");
   a->ChangeLabel(5,-1,-1,-1,-1,-1," ");
   a->ChangeLabel(6,-1,-1,-1,-1,-1,"50.");
   a->ChangeLabel(7,-1,-1,-1,-1,-1,"90.");
   a->ChangeLabel(8,-1,-1,-1,-1,-1,"99.");
   a->ChangeLabel(9,-1,-1,-1,-1,-1,"99.9");
   a->ChangeLabel(10,-1,-1,-1,-1,-1,"99.99");
}

This topic was automatically closed 14 days after the last reply. New replies are no longer allowed.