Hi,
I would like to adjust xAxis of a variable within my tree.
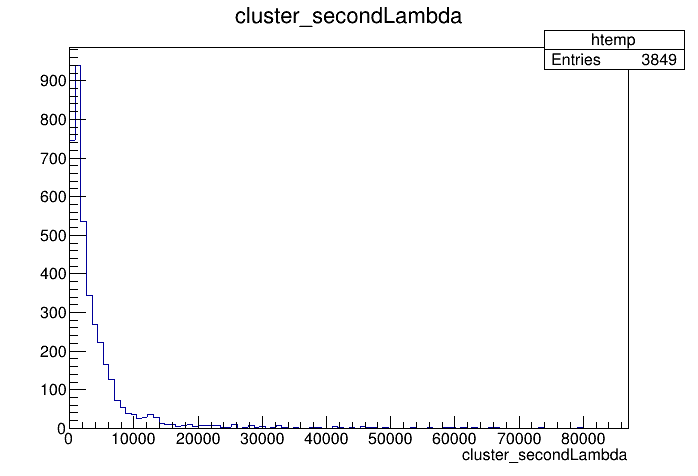
when I draw it by simply doing
Tree->Draw("") I got
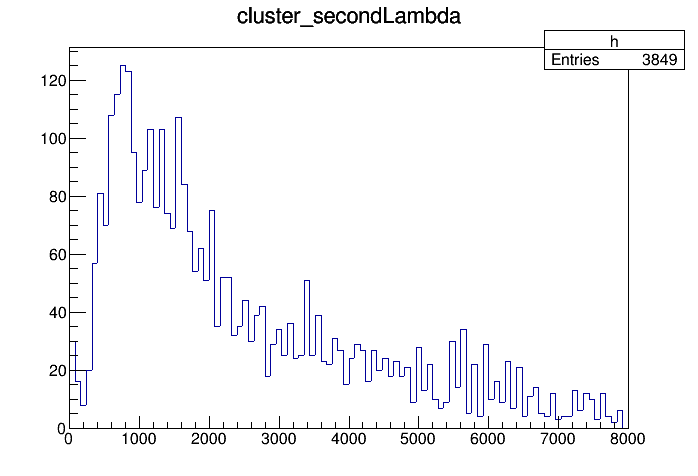
Now adjusting the xAxis by doing
I got this new one
The question is I wasn’t expected that vertical axis will be changed ? I’m not sure what I did is correct or not
Thanks
couet
May 15, 2020, 6:24am
2
The number of bins … both histograms have 100 … but the ranges are totally different on X. reduce the number of bins for the 2nd one and the maximum will be higher. Or use the 1st one and change the X axis range of the htemp histogram created by the TTrre::Draw command
changing the xAxis is what really am intending to do. Is what I did here correct ? BTW is there another to change xAxis of the histog crated by TTree?
thanks a lot
couet
May 15, 2020, 10:48am
4
Not really because you kept the same number of bins.
Yes:
Tree->Draw("x")
auto htemp = (TH1F*)gPad->GetPrimitive("htemp");
htemp->GetXaxis()->SetRangeUser(0.,8000.)
Isnt the
couet
May 18, 2020, 8:51am
6
Yes that’s equivalent of what @yassine did. But the number of bin is still an issue if you want to keep the same maximum as with the full range.
Thanks that’s was helpful. keeping the same binning while reducing the x range results really on a quiet no informative distribution.