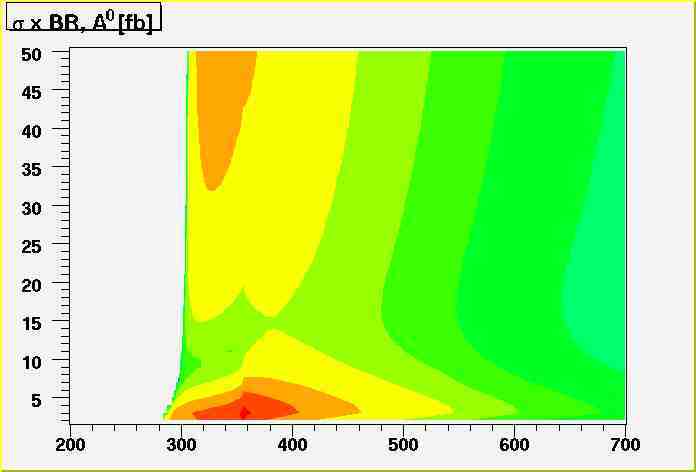
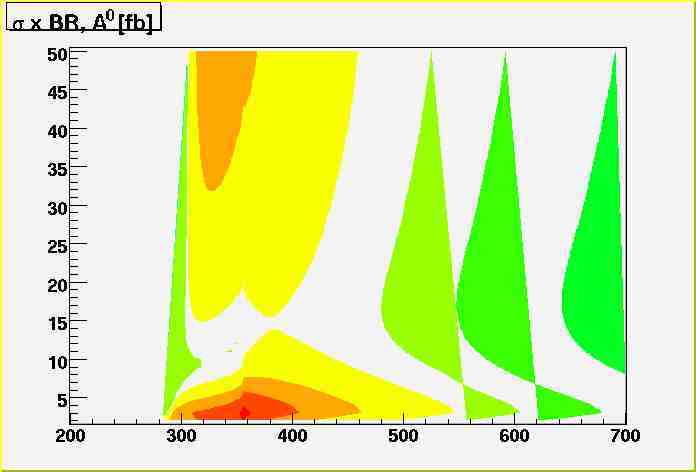
I’d like to use a contour plot with “cont4” option instead of “colz” because it looks much nicer. With “colz” I use an additional “cont3” plot to improve the visibility of the contour levels. As I have read and have experienced myself, this is not possible with “cont4” plots, the “cont3” plot is just never visible. Is there a different way to draw those lines or a solution how to draw the “cont3” plot?