ROOT Version: 5.34 Platform: Ubuntu 16.04 LTS
Hi!
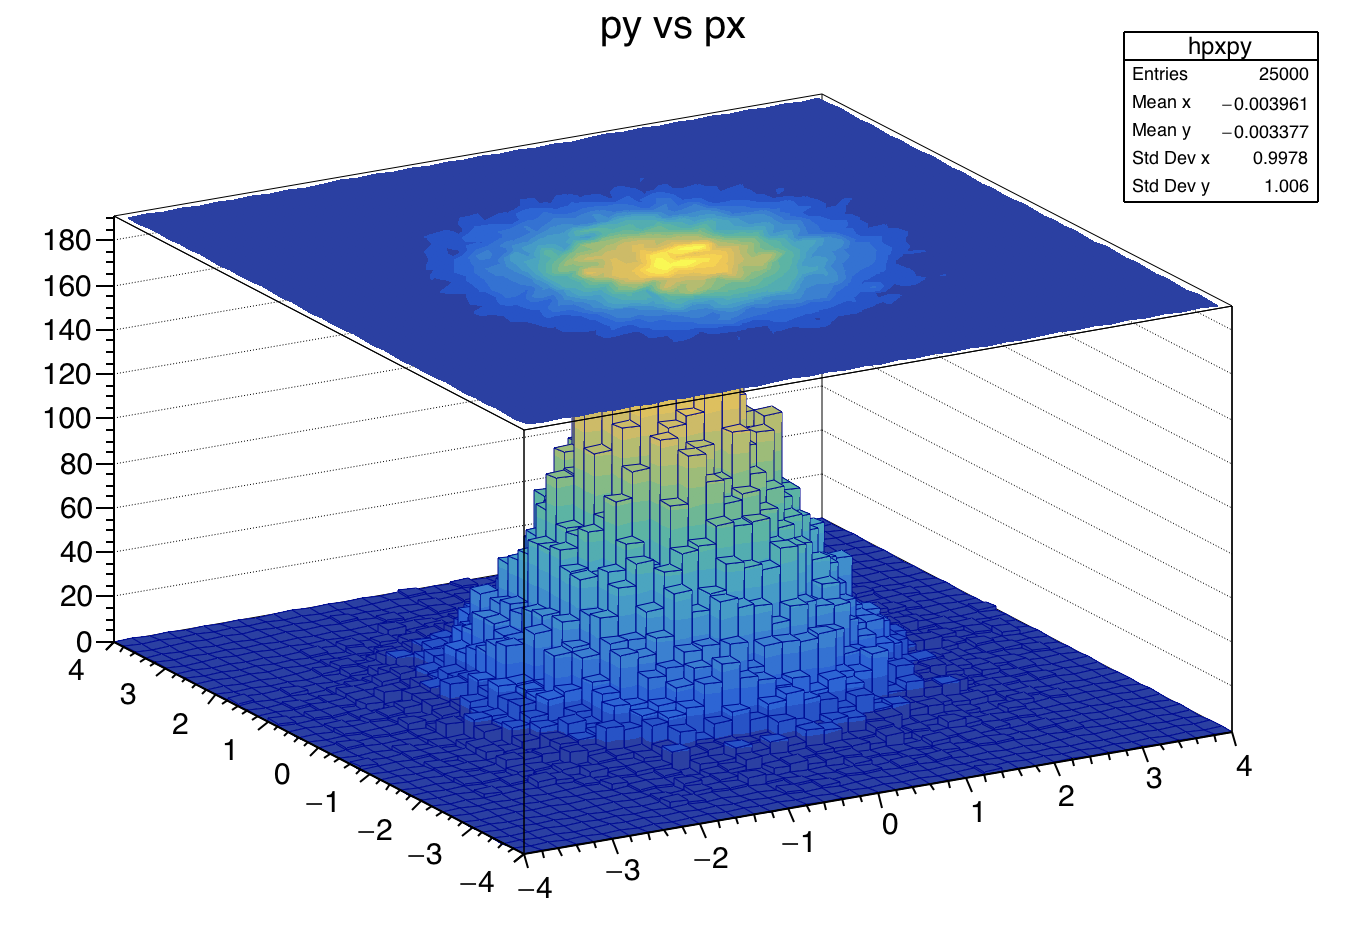
I was drawing TH2 histograms and I would like to draw a filled contour plot on top of a lego histogram. For example, I want to put the contour plot of the right image on the top of the left one. Someone knows how can I do that?
Thanks in advance!
{
   hpxpy->Draw("lego2");
   TH2D *h = (TH2D*)hpxpy->DrawClone("surf3 same");
   h->SetLineColorAlpha(kRed,0.);
   gPad->Modified();
   gPad->Update();
}
This topic was automatically closed 14 days after the last reply. New replies are no longer allowed.