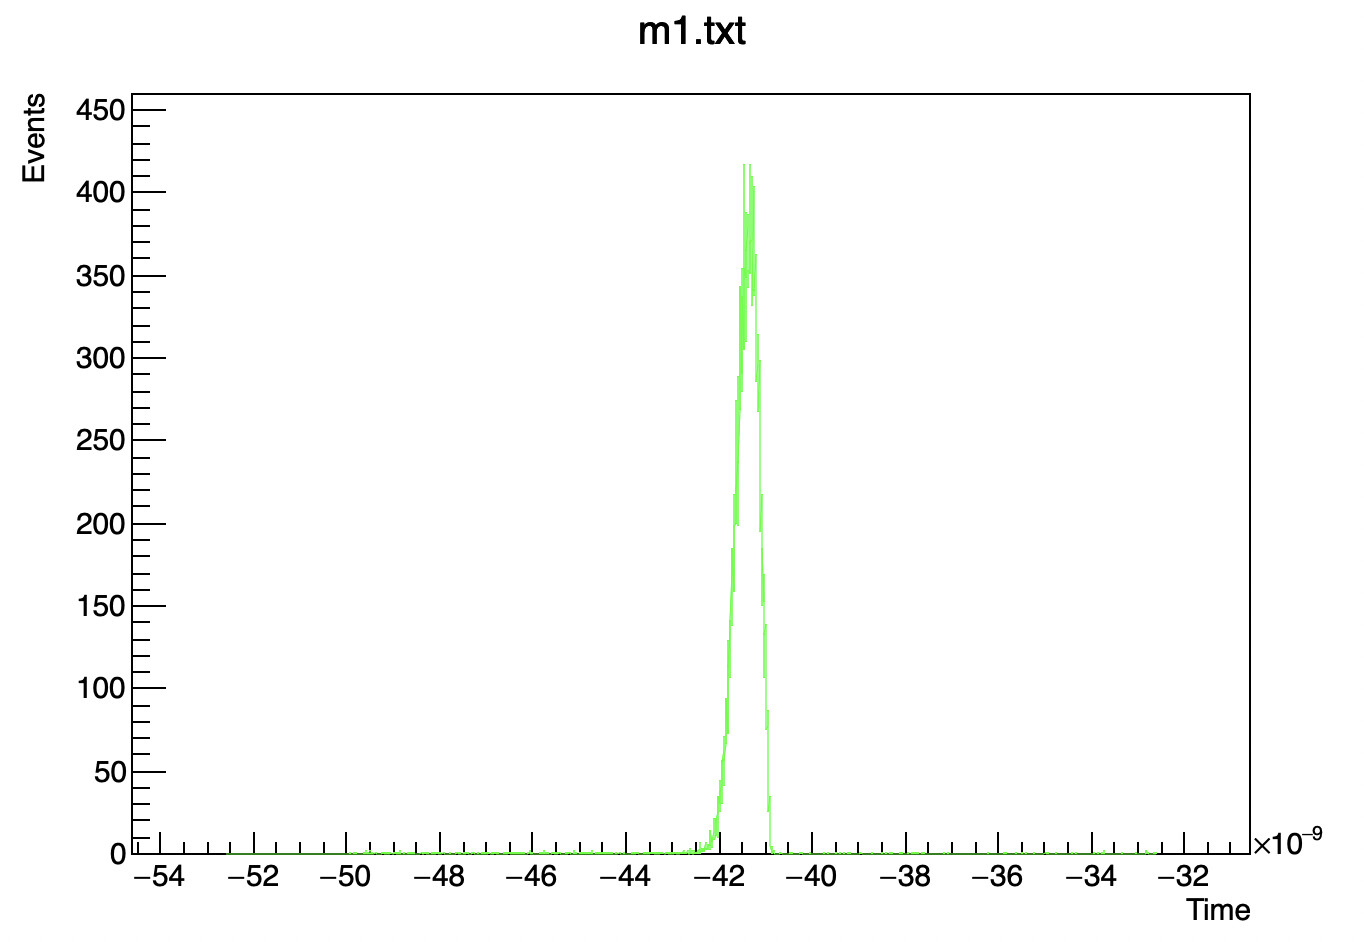
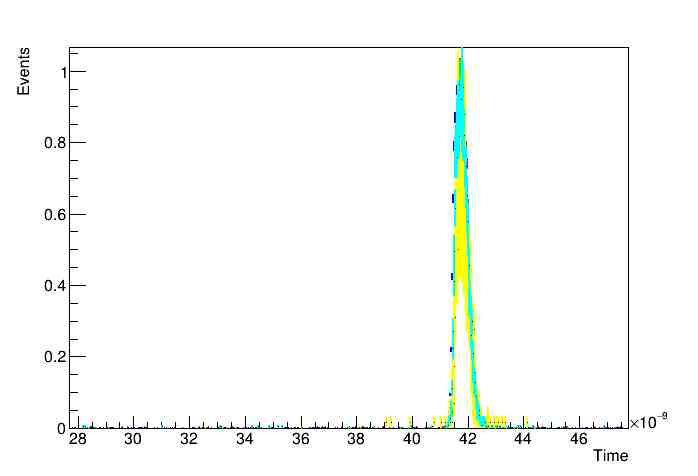
Is there any way to plot many files on same canvas and give X axis a desired range?
I did the following, but getting a plot like attached one. Also, can I plot a smooth line in the plot? changing the Draw() options is not helping.
void combined(Double_t xMin=0.00000001, Double_t xMax=0.00000007)
{
TGraph *g1 = new TGraph(“F1–180v–00012.txt”);
// g->Sort(); // just a precaution
Int_t n1 = g1->GetN();
TGraph *g2 = new TGraph(“F1–180v–00013.txt”);
Int_t n2 = g2->GetN();
TGraph *g3 = new TGraph(“F1–180v–00014.txt”);
Int_t n3 = g3->GetN();
TGraph *g4 = new TGraph(“F1–180v–00015.txt”);
Int_t n4 = g4->GetN();
TGraph *g5 = new TGraph(“F1–180v–00016.txt”);
Int_t n5 = g5->GetN();
// note: if the graph’s points “x coordinates” are not equidistant,
// they will usually not coincide with the histogram’s “bin centers”
Double_t *x1 = new Double_t[(n1 + 1)];
x1[0] = (3.0 * g1->GetX()[0] - g1->GetX()[1]) / 2.0;
x1[n1] = (3.0 * g1->GetX()[(n1 - 1)] - g1->GetX()[(n1 - 2)]) / 2.0;
for (Int_t i = 1; i < n1; i++)
{ x1[i] = (g1->GetX()[(i - 1)] + g1->GetX()[i]) / 2.0; }
Double_t *x2 = new Double_t[(n2 + 1)];
x2[0] = (3.0 * g2->GetX()[0] - g2->GetX()[1]) / 2.0;
x2[n2] = (3.0 * g2->GetX()[(n2 - 1)] - g2->GetX()[(n2 - 2)]) / 2.0;
for (Int_t i = 1; i < n2; i++)
{ x2[i] = (g2->GetX()[(i - 1)] + g2->GetX()[i]) / 2.0; }
Double_t *x3 = new Double_t[(n3 + 1)];
x3[0] = (3.0 * g3->GetX()[0] - g3->GetX()[1]) / 2.0;
x3[n3] = (3.0 * g3->GetX()[(n3 - 1)] - g3->GetX()[(n3 - 2)]) / 2.0;
for (Int_t i = 1; i < n3; i++)
{ x3[i] = (g3->GetX()[(i - 1)] + g3->GetX()[i]) / 2.0; }
Double_t *x4 = new Double_t[(n4 + 1)];
x4[0] = (3.0 * g4->GetX()[0] - g4->GetX()[1]) / 2.0;
x4[n4] = (3.0 * g4->GetX()[(n4 - 1)] - g4->GetX()[(n4 - 2)]) / 2.0;
for (Int_t i = 1; i < n4; i++)
{ x4[i] = (g4->GetX()[(i - 1)] + g4->GetX()[i]) / 2.0; }
Double_t *x5 = new Double_t[(n5 + 1)];
x5[0] = (3.0 * g5->GetX()[0] - g5->GetX()[1]) / 2.0;
x5[n5] = (3.0 * g5->GetX()[(n5 - 1)] - g5->GetX()[(n5 - 2)]) / 2.0;
for (Int_t i = 1; i < n5; i++)
{ x5[i] = (g5->GetX()[(i - 1)] + g5->GetX()[i]) / 2.0; }
TH1D *h1 = new TH1D(“h1”, " ;Time;Events", n1, x1);
for (Int_t i = 0; i < n1; i++) {
h1->SetBinContent(i + 1, g1->GetY()[i]);
}
h1->ResetStats();
h1->GetXaxis()->SetRangeUser(xMin, xMax); // reset the statistics including the number of entries
TH1D *h2 = new TH1D(“h2”, " ;Time;Events", n2, x2);
for (Int_t i = 0; i < n2; i++) {
h2->SetBinContent(i + 1, g2->GetY()[i]);
}
h2->ResetStats();
TH1D *h3 = new TH1D(“h3”, “10Hz;Time;Events”, n3, x3);
for (Int_t i = 0; i < n3; i++) {
h3->SetBinContent(i + 1, g3->GetY()[i]);
}
h3->ResetStats();
TH1D *h4 = new TH1D(“h4”, “20Hz;Time;Events”, n4, x4);
for (Int_t i = 0; i < n4; i++) {
h4->SetBinContent(i + 1, g4->GetY()[i]);
}
h4->ResetStats();
TH1D *h5 = new TH1D(“h5”, “40Hz;Time;Events”, n5, x5);
for (Int_t i = 0; i < n5; i++) {
h5->SetBinContent(i + 1, g5->GetY()[i]);
}
h5->ResetStats();
delete [] x1; // no longer needed
delete g1; // no longer needed
delete [] x2; // no longer needed
delete g2;
delete [] x3; // no longer needed
delete g3;
delete [] x4; // no longer needed
delete g4;
delete [] x5; // no longer needed
delete g5;
gStyle->SetOptStat(“0000”);
h1->Draw();
h1->SetLineColor(kBlue);
h1->SetLineWidth(2);
h1->GetXaxis()->SetRange(0.000000041,0.000000043);
h1->Scale(1.0/h1->GetMaximum());
//h1->Scale(1/h1->Integral(0,-1));
//h1->GetRms();
h2->Draw(“same”);
h2->SetLineColor(kRed);
h2->SetLineWidth(2);
//h2->GetXaxis()->SetRange(0.000000041,0.000000043);
h2->Scale(1.0/h2->GetMaximum());
//h2->Scale(1/h2->Integral(0,-1));
//h2->GetRms();
h3->Draw(“same”);
h3->SetLineColor(kGreen);
h3->SetLineWidth(2);
//h3->GetXaxis()->SetRange(0.000000041,0.000000043);
h3->Scale(1.0/h3->GetMaximum());
//h3->Scale(1/h3->Integral(0,-1));
//h3->GetRms();
h4->Draw(“same”);
h4->SetLineColor(kYellow);
h4->SetLineWidth(2);
//h4->GetXaxis()->SetRange(0.000000041,0.000000043);
h4->Scale(1.0/h4->GetMaximum());
//h4->Scale(1/h4->Integral(0,-1));
//h4->GetRms();
h5->Draw(“same”);
h5->SetLineColor(kCyan);
h5->SetLineWidth(2);
//h5->GetXaxis()->SetRange(0.000000041,0.000000043);
h5->Scale(1.0/h5->GetMaximum());
//h5->Scale(1/h5->Integral(0,-1));
//h5->GetRms();
//auto legend = new TLegend(0.1,0.7,0.48,0.9);
//legend->SetHeader(“The Legend Title”,“C”); // option “C” allows to center the header
//legend->AddEntry(“h1”,“2.5Hz,rms=83.12ps”,“l”);
//legend->AddEntry(“h2”,“5Hz, rms=83.08ps”,“l”);
//legend->AddEntry(“h3”,“10Hz, rms=99.69ps”,“l”);
//legend->AddEntry(“h4”,“20Hz, rms=97.73ps”,“l”);
//legend->AddEntry(“h5”,“40Hz, rms=98.63ps”,“l”);
//legend->Draw();
//gStyle->SetOptStat(“eMR”);
// g->SetMarkerStyle(20); g->Draw(“P”);
}