When I run the macro attached here like 3 or 4 times, I start getting the same histogram plot every single time. I thought the use of TRandom3 meant I should be getting different plots since the data points generated are pseudo-random. I have attached the gif file here. Does anyone know why that is the case?
Also, root keeps on giving me following warnings:
Warning in TROOT::Append: Replacing existing TH1: sig_h (Potential memory leak).
Warning in TROOT::Append: Replacing existing TH1: gaus_h1 (Potential memory leak).
Warning in TROOT::Append: Replacing existing TH1: gaus_h2 (Potential memory leak).
Warning in TROOT::Append: Replacing existing TH1: exp_h (Potential memory leak).
Warning in TROOT::Append: Replacing existing TH1: exp_h (Potential memory leak).
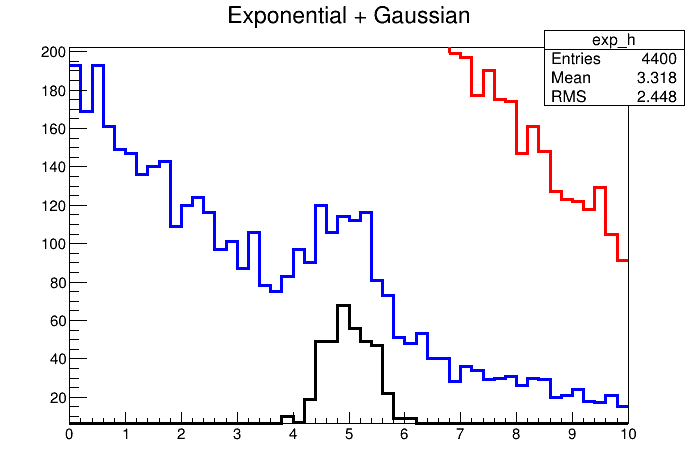
If I run the macro again, I get a different kind of plot, but the histograms indicated by red and blue color are still being plotted as in the first run.
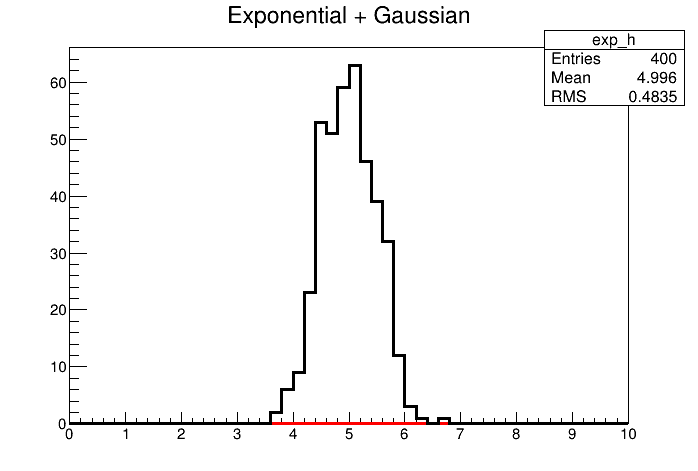
But after the third run and further, the histogram indicated by red just flattens out (as shown in the main question body), and no matter how many times I run the macro, it stays that way. I cannot even see the blue one.
Processing histexample3.cpp...
In file included from input_line_11:1:
/Users/couet/Downloads/histexample3.cpp:18:7: error: use of undeclared identifier 'exp_h'
      exp_h->Fill(rndgen.Exp(4));
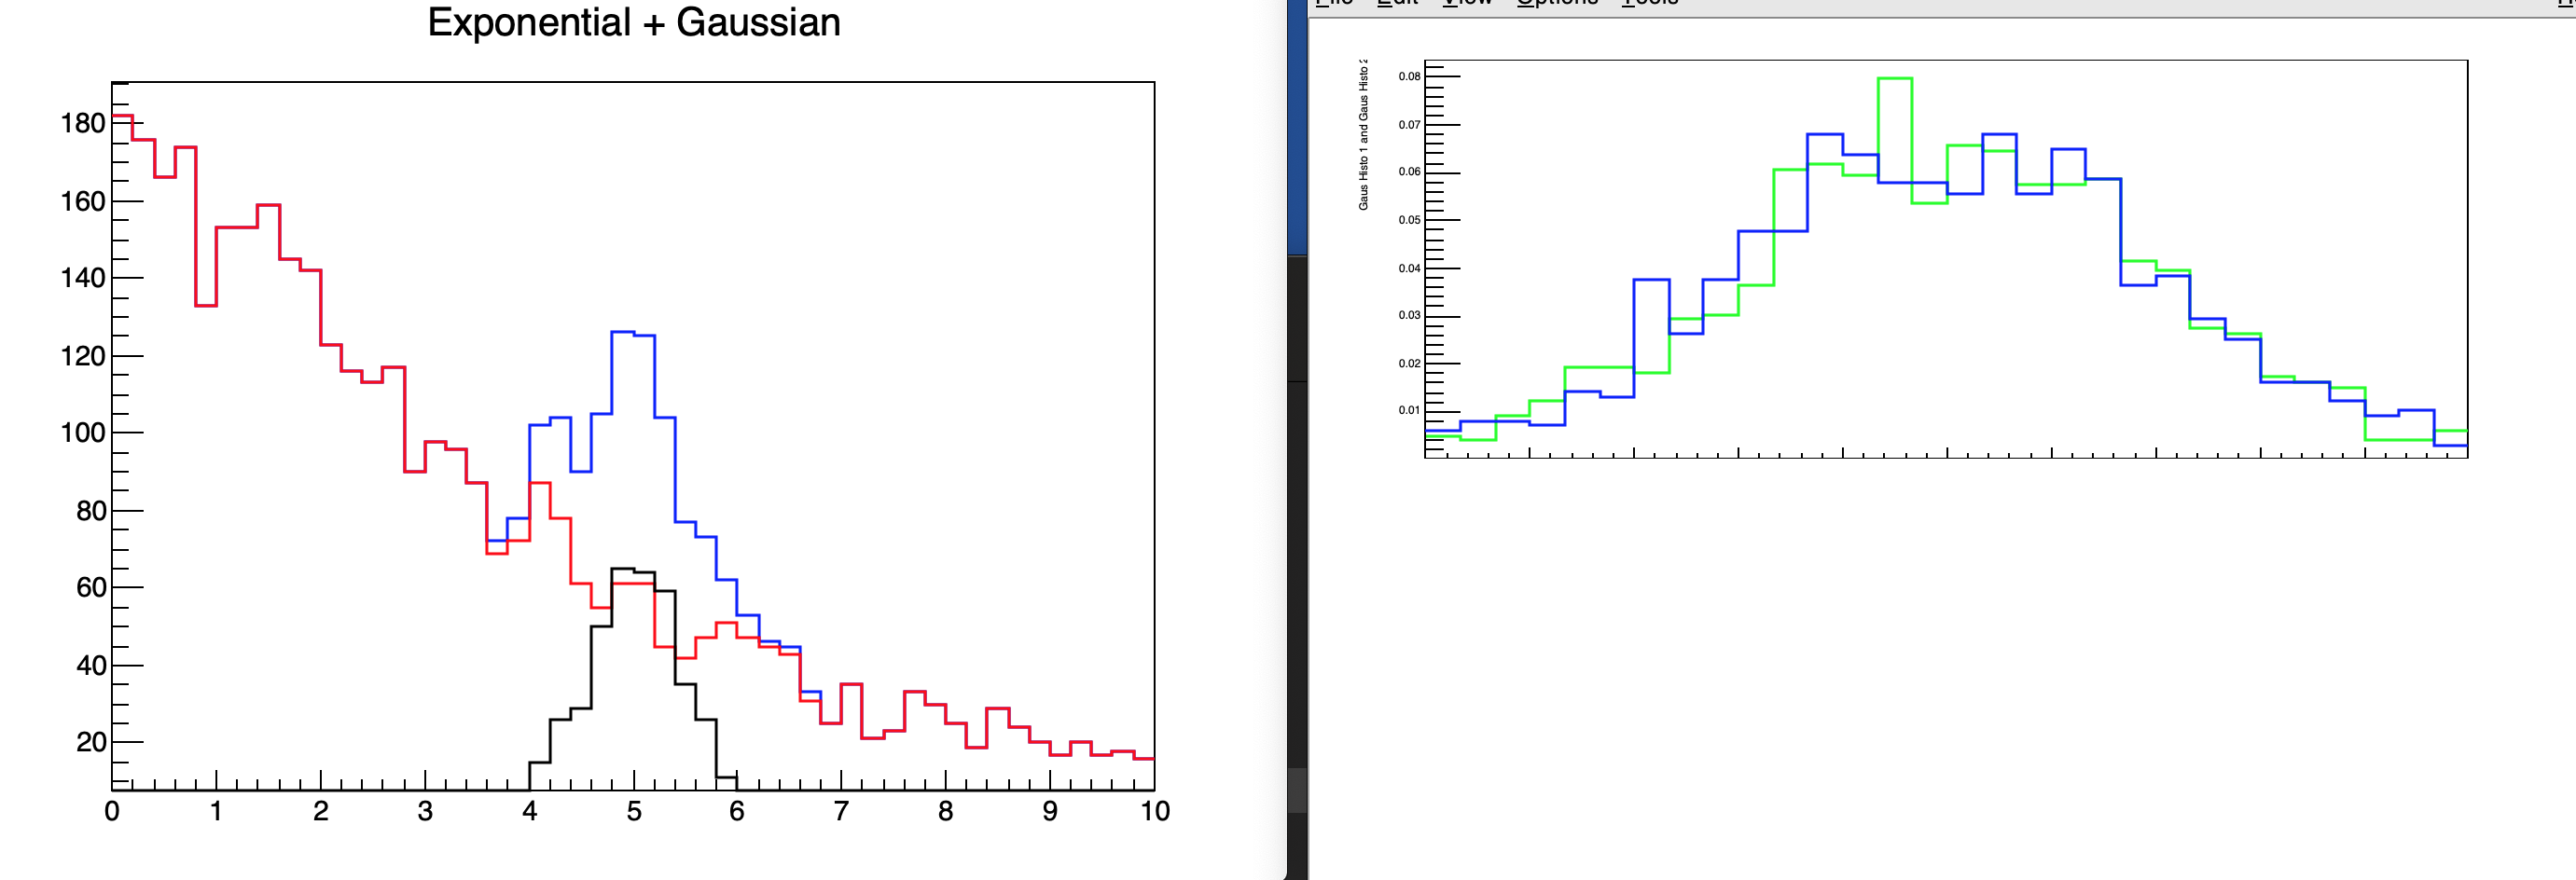
For me, it does not show that error. Furthermore, based on some other questions posted in the forum, I have modified the code a bit by including few lines from line 13-18 in my new code attached here. This does not give any memory leak warnings. histexample3.cpp (2.2 KB)
I completely did not see it, but I am not lying when I say that my code is running fine just the way it is right now. But now, I have changed bkg_h to exp_h everywhere.
In my original code in the question (where the second canvas is not a part of the code), I am only trying to plot Exponential+Gaussian plot. Let’s say, I run it in root, it works fine. I get something similar to what you have on the left side. Let’s say, I close the canvas window and run the macro again, I get something similar. But when I do it the third time and more, I keep on getting something like this:
No matter how many times, I run the macro, the histogram indicated by red color just flattens out totally, and I don’t even see blue one anymore. That was my original question.