Hi, Rooters,
I was hoping to do this for a 2-D histogram, but I am taking a 1-D as an example which is presumably easier to explain: finding the points corresponding to 99.5% bin content of each bin, then fit these points. For instance, for a histogram has 3 bins: bin1 content = 100, bin2 content = 1000; bin3 content = 10,000.
I was hoping to: 1, adding these three points of 99.5, 995 and 9950 on the histogram (on-site);
2, fitting these three points (bin1, 99.5; bin2, 995; bin3 9950).
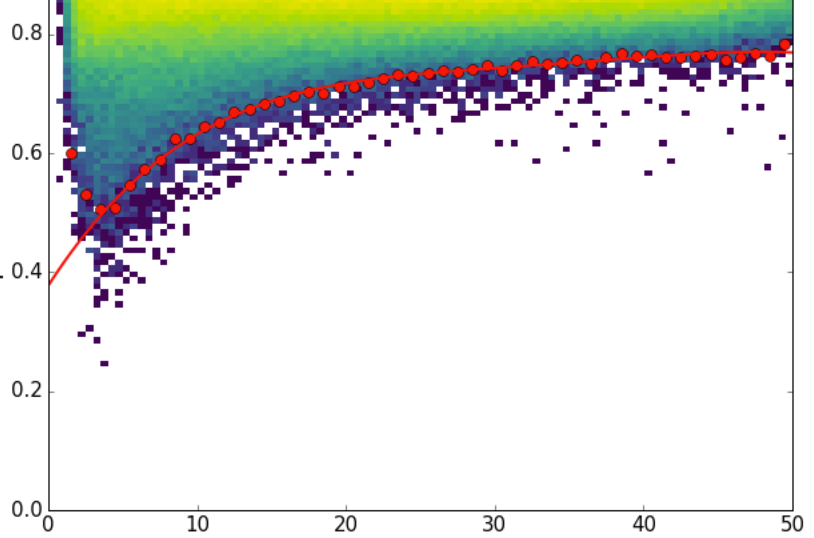
The attached screenshot was have done by my college on Python (for a 2-D histogram, not 1-D). I want to know wether this is achievable on ROOT ?
I know I can take the points out and fitting on a TGraph. Ideally, it would be nicer to do it on the same histogram, instead of doing it with a separate plot, as the screenshot shown.
Thanks.
Best,
Jun
Please provide the following information:
ROOT Version (e.g. 6.12/02):
6.08.02
Platform, compiler (e.g. CentOS 7.3, gcc6.2):
Mac OS High Sierra 10.13.4
Apple LLVM version 8.1.0 (clang-802.0.41)