I usually use TGaprh/TMultiGraph to make some plots, and i want to add a grid to some of them.
My requirements are:
Being able to determine the distane between grid lines.
Grid lines must appear in the front of the image.
Must have lines and not dots.
I already asked about this here but the solution i was offered is not good because SetNdivisions is limited to 100 grid lines (my range is about -15,000 to 15000 units and i want a grid line every 5 units).
I am new to ROOT and this is a bit confusing.
You should have continued with the previous thread instead of opening a new one. Any way if you need more than 99 divisions it is clear that the number of divisions parameter will not allow to define that.
Note that the plot you are showing has much less than 100 divisions … also if you are drawing that many divisions I am afraid the plot will be completely unreadable unless you produce a large output.
I think you need some custom way of drying the grid line by line. Do you have any example or plot showing exactly what you need ? the macro i posted in the other thread was just a example. You did not says you need 100 grid lines.
Finally you said:
The macro I sent you before fulfil completely these requirements.
Sorry about the new post, the first one was closed. My demands are also more clear to me right now.
The plot i showed has less than a 100 divisions because, as you said it is not possible.
i don’t mind producing a large output, but even a smaller size would require more than a 100 divisions.
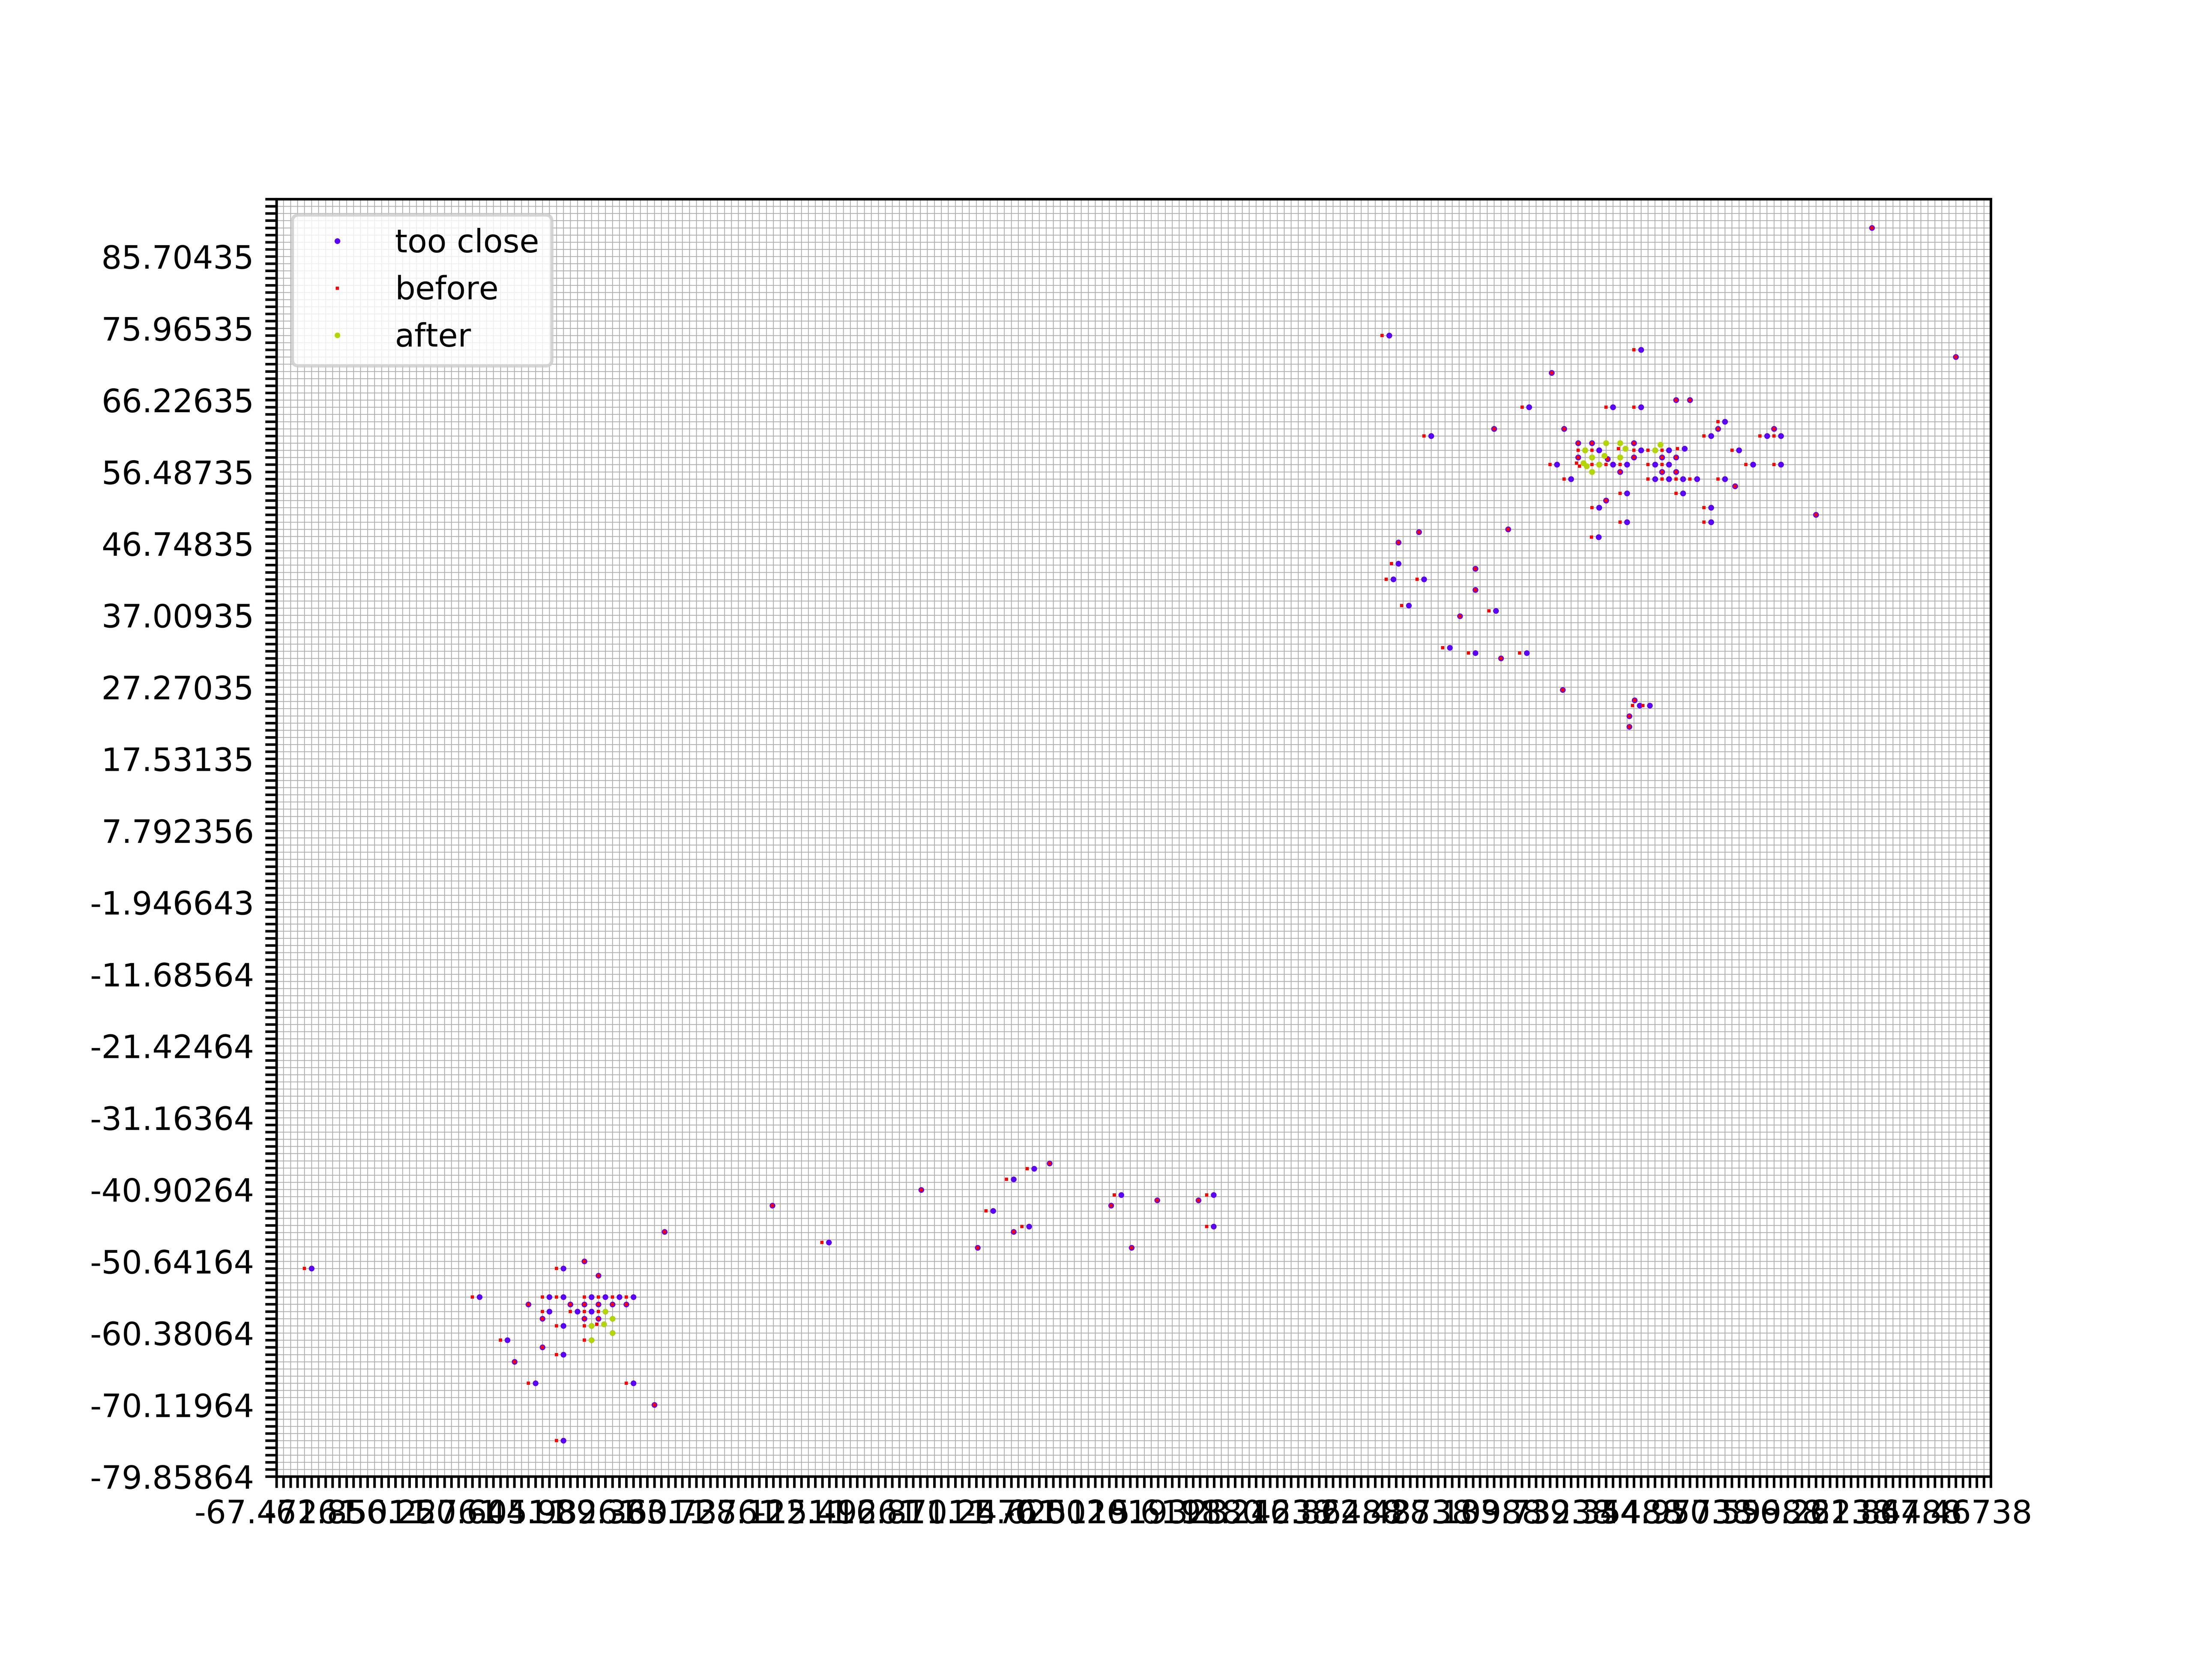
when I run youre macro with the the root terminal it seems to work, but this make the rest of my code crash. When I compile it with g++ I get the above plot.
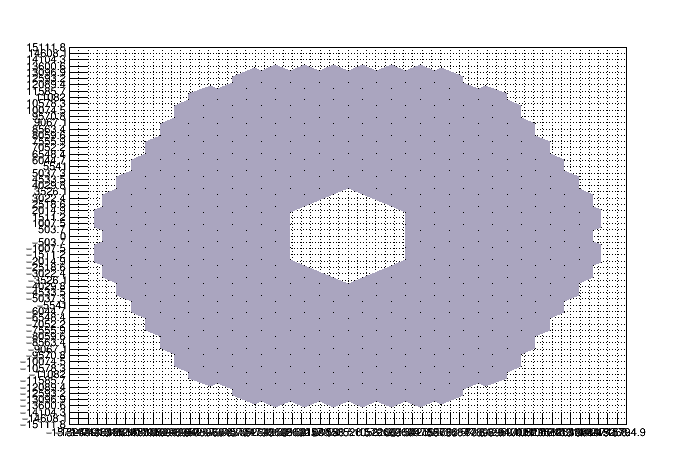
This image was produced with matplotlib, i would like something similar in ROOT: