Dear All,
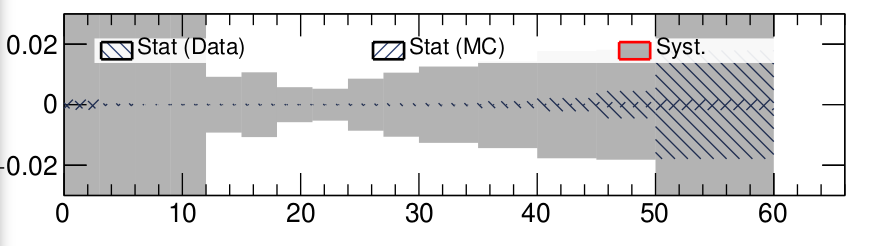
I’ve created the following figure using TGraphAsymmErrors. The plot shows the relative uncertainty in each bin of a measurement.
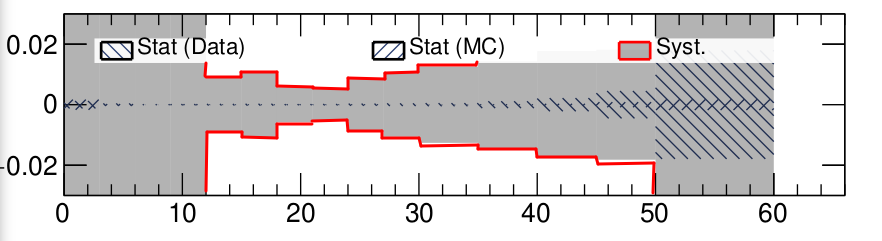
I’d like to add a boundary line around the shaded area like conceptually sown in the figure below, which I added by hand to illustrate the idea.
How can I do this using TGraphAsymmErrors?
Best regards,
Christof
Axel
2
You can create one histo containing the upper variation and one containing the lower one, and then draw both as "SAME". Does this hint get you there?
couet
3
Something like that:
{
   double x[] = {0, 1, 2, 3, 4};
   double y[] = {0, 2, 4, 1, 3};
   double ex[] = {0.1, 0.2, 0.3, 0.4, 0.5};
   double ey[] = {1, 0.5, 1, 0.5, 1};
   auto ge = new TGraphErrors(5, x, y, ex, ey);
   ge->SetTitle("Errors as a band");
   ge->SetFillColor(3);
   ge->SetFillStyle(1001);
   ge->Draw("a3");
   TGraphErrors *ge2 = (TGraphErrors*)ge->DrawClone("3");
   ge2->SetFillColor(2);
   ge2->SetFillStyle(0);
   gPad->Modified();
   gPad->Update();
}