Hi Lorenzo,
that is a fundamental question for which I have no answer at the moment: What value does the (two-sided) profile likelihood ratio test statistic have when there is are no events in a dataset, which should happen frequently for models with very low expected background and while scanning small signal values with the RooStats::HypoTestInverter?
If I modify my script (code below) and plot the profile likelihood ratio for the same model but for an empty data set, I get the following curve:
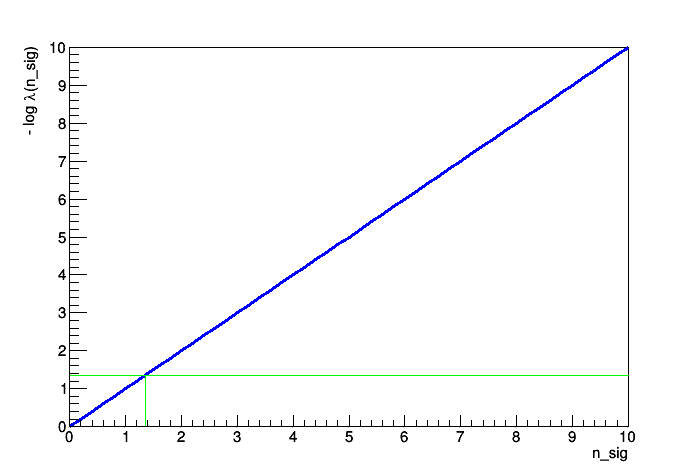
which also shows a value of zero for n_sig = 0. So that would match with what I got above.
But I’m happy to hear some more thoughts on this or a if anyone has a reference to look into.
Lukas
Code:
#!/usr/bin/env python

import ROOT
from ROOT import RooFit as RF
from ROOT import RooStats as RS

# ROOT settings
ROOT.Math.MinimizerOptions.SetDefaultMinimizer('Minuit2')

# Workspace
w = ROOT.RooWorkspace('w')

# Observable
E = w.factory('E[0.,100.]')

# Constrained parameters and constraint PDF
mean = w.factory('mean[50.,49.,51.]')
mean_obs = w.factory('mean_obs[50.,49.,51.]')
mean_obs.setConstant(True)
mean_err = w.factory('mean_err[0.2]')
cpdf_mean = w.factory('Gaussian::cpdf_mean(mean,mean_obs,mean_err)')

sigma = w.factory('sigma[1.,0.5,1.5]')
sigma_obs = w.factory('sigma_obs[1.,0.5,1.5]')
sigma_obs.setConstant(True)
sigma_err = w.factory('sigma_err[0.1]')
cpdf_sigma = w.factory('Gaussian::cpdf_sigma(sigma,sigma_obs,sigma_err)')

# Signal
n_sig = w.factory('n_sig[0.,0.,10.]')
pdf_sig = w.factory('Gaussian::pdf_sig(E,mean,sigma)')

# Background
n_bkg = w.factory('n_bkg[10.,0.,50.]')
pdf_bkg = w.factory('Polynomial::pdf_bkg(E,{})')

# PDF
pdf_sum = w.factory('SUM::pdf_sum(n_sig*pdf_sig,n_bkg*pdf_bkg)')
pdf_const = w.factory('PROD::pdf_const({pdf_sum,cpdf_mean,cpdf_sigma})')

# ModelConfig
mc = RS.ModelConfig('mc', w)
mc.SetPdf( pdf_const )
mc.SetParametersOfInterest( ROOT.RooArgSet(n_sig) )
mc.SetObservables( ROOT.RooArgSet(E) )
mc.SetConstraintParameters( ROOT.RooArgSet(mean, sigma) )
mc.SetNuisanceParameters( ROOT.RooArgSet(mean, sigma, n_bkg) )
mc.SetGlobalObservables( ROOT.RooArgSet(mean_obs, sigma_obs) )

# Create empty dataset
data = ROOT.RooDataSet('data', 'data', ROOT.RooArgSet(E))

# Profile Likelihood
pl = RS.ProfileLikelihoodCalculator(data, mc)
pl.SetConfidenceLevel(0.90)

interval = pl.GetInterval()
print (interval.LowerLimit(n_sig), interval.UpperLimit(n_sig))

plot = RS.LikelihoodIntervalPlot(interval)
plot.SetNPoints(50)
plot.Draw("")