_ROOT Version:5/34/10 Platform: Not Provided Compiler: Not Provided
Hi,
Thanks in advance to answer me,
I have Two TH2D histograms, and these histograms are weighted by positive and negative values. I need the ratio of these histograms. When I take the ratio and draw with “colz” I have the negative and positive values. How can I have the absolute value of Z axis for the ratio?
Thanks
I guess you need to make a new histogram containing the absolute values. You loop on all the bins of the original one with v = GetBinContent(i,j) and you fill the new one with SetBinContent(i,j,abs(v))
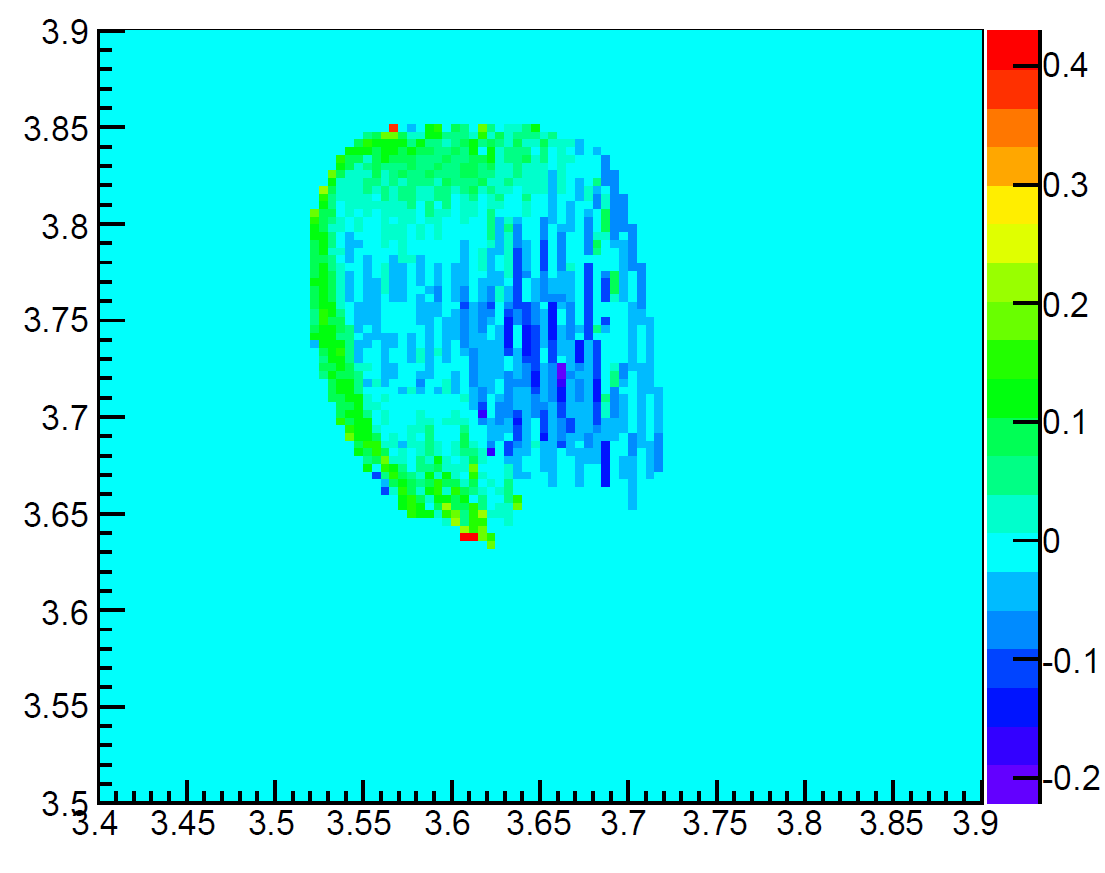
I have another question, I have a TH2D histogram with positive and negative values. How can I set the colors of histogram when I draw it in “colz”? For example I want to have white color for zero value. I uploaded a photo as an example
You can change the colour palette for the scale with gStyle->SetPalette(…), see here: https://root.cern.ch/doc/master/classTColor.html#C05
You can either define your own colours, as they show in the first example (giving 2 inputs to SetPalette), or use one of the predefined combinations (look for “high quality predefined palettes” some lines below, in that page) by just giving one input to SetPalette. But notice that root 5, which you are using, has fewer predefined palettes – I don’t know for sure which numbers it accepts, but at least the numbers 51 to 56 work; e.g. try gStyle->SetPalette(51) or 52, etc. and see if any of them looks the way you want; if none works, you may have to define your own set of colours.
As an alternative, and if you will not have negative values in a 2D plot, try this: do not fill the bins where the value is zero --do not fill them with the value zero, just don’t do a SetBinContent; root will leave those (empty) bins blank, independently of the palette.