A weird plot of hypothesis test invention

Hi,

I’ve recently launched a hypothesis test invention and obtained a weird plot as attached.
Why the CLs+b and CLb haven’t been shown here ?

I have checked other plot options like “OBS”, “CLb” on this website, root.cern.ch/root/html/RooStats … rPlot:Draw
It doesn’t help.

Can any expert here tell me what’s wrong with it please ?

Thanks in advance !

Cheers,
Junhui


Hi,

You are getting large value of CLs, probably caused by small values of CLb. This is very likely a configuration problem, using wrong models (like the alt model is not the b only model) or the models are not configured correctly in the ModelConfig.
If you post your workspace as a binary root film, I could understand better your problem

Best Regards

Lorenzo

Hi, Lorentz,

Thanks for reply !

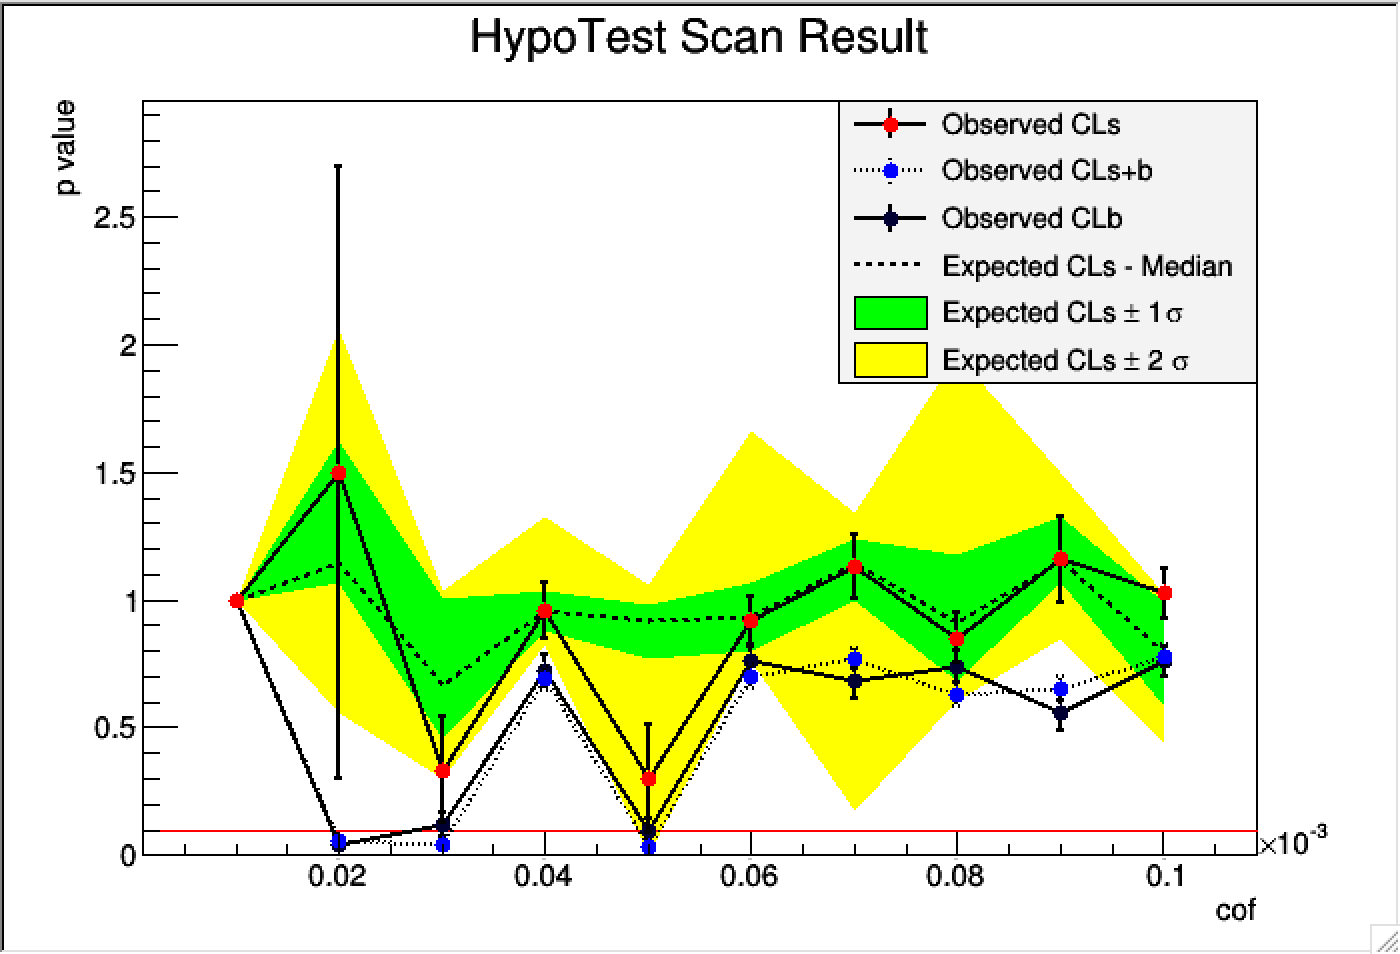
You’re right, the p values of CLb and CLs+b are both very small.
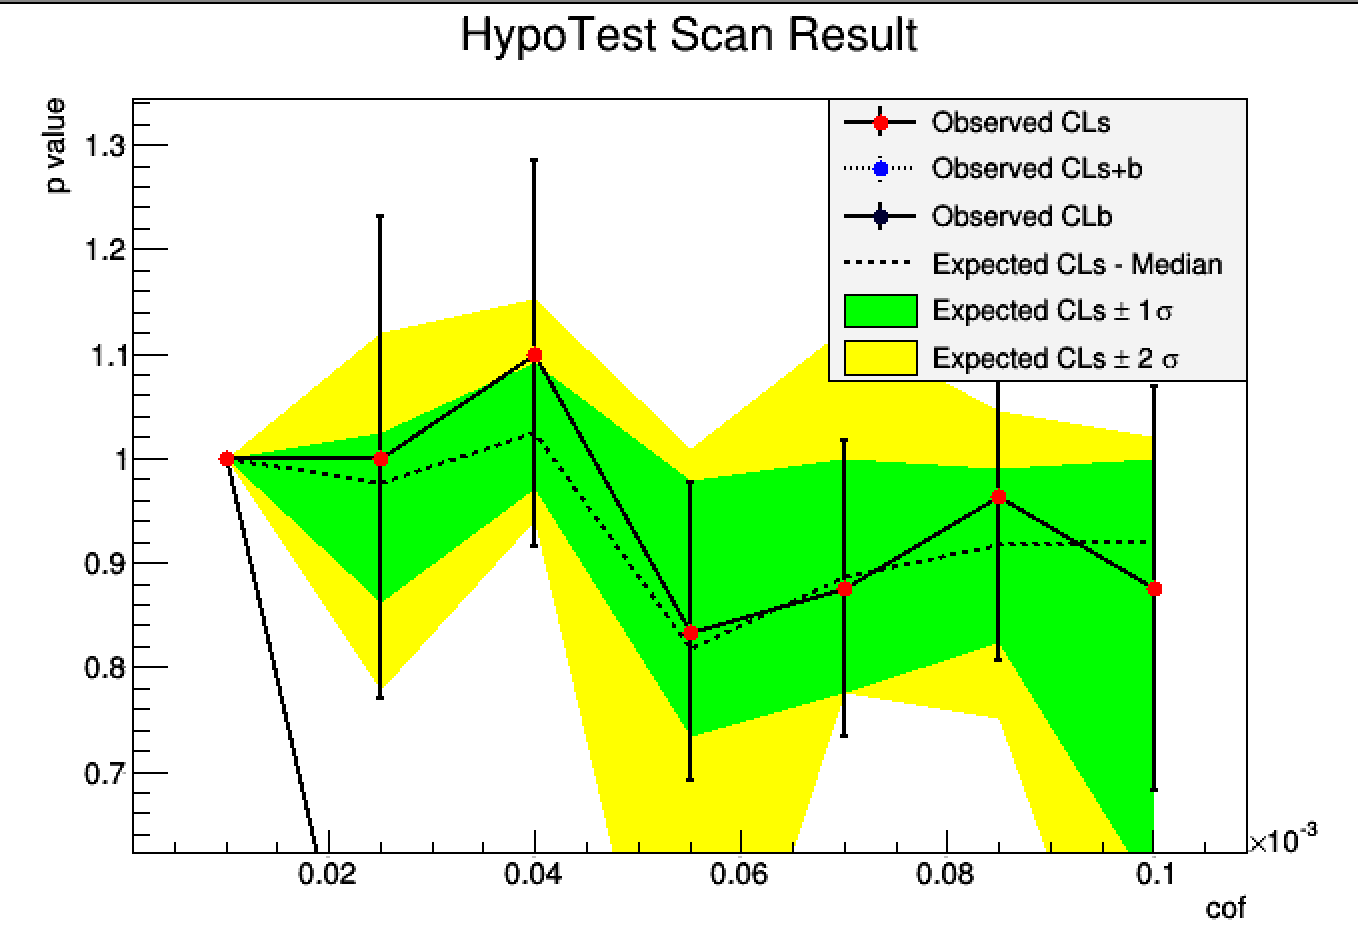
By changing to another model and a smaller dataset, I got a better one.
Comparing to previous plot, this improves significantly I guess.

From this plot, for the cof < 0.06 * 10^-3 = 6*10^-5, the p values of CLb is slightly bigger than CLs+b, so I guess data prefers to CLb(background model only), right ?
Or how to interpret this plot properly ?
Any suggestions for further analysis , for instance, shall I try the analysis of discovery instead ?


The model is attached here, please comment.
BTW, I’ve checked that if POI = 0, the signal model is zero and only the background one survived.

Thanks !

Cheers,
Junhui

#include "TTree.h"
#include "TH1.h"

using namespace RooFit;
using namespace RooStats;

void CountingModel(  int nsig = 1,
                                int nbkg = 1)      
{
   RooWorkspace w("w");

   ///~~~~~~~~~~~~~~~~~~  Begining of creating a model p.d.f. ~~~~~~~~~~~~~~///

  RooClassFactory::makePdf("BkgLinearPdf","x,A,B") ;
#ifdef __CINT__
  gROOT->ProcessLineSync(".L BkgLinearPdf.cxx+") ;
#endif


  RooClassFactory::makePdf("OOnePdf","x,cof") ;
#ifdef __CINT__
  gROOT->ProcessLineSync(".L OOnePdf.cxx+") ;
#endif

   w.factory("BkgLinearPdf:bkg_pdf(x[0.021,10], a[2.5,1.0,30.0], b[-0.015,-0.010])");/// a,interceipt; b, slope.

   w.factory("OOnePdf:sig_pdf(x[0.021,10],cof[5.0E-5,1.0E-5,1.0E-4])");

   w.factory("SUM:model(nsig[0,20]*sig_pdf, nbkg[0,20]*bkg_pdf)");// for extended model(poisson). 20 from data
 

   ///~~~~~~~~~~~~~~~~~~  End of creating a model p.d.f. ~~~~~~~~~~~~~~///

   
   ///~~~~~~~  Begining of creating the ModelConfig object and set "b0" as a global observable ~~~///

   w.var("nsig")->setVal(nsig);  // assign the nsig value defined above into w sapce. 
   w.var("nbkg")->setVal(nbkg); 
   w.var("b")->setConstant(true); // needed for being treated as global observables
   
   ModelConfig mc("ModelConfig",&w);/// declare the name and reference of ModelConfig as "mc" and "ModelConfig".
   mc.SetPdf(*w.pdf("model")); 
   mc.SetParametersOfInterest(*w.var("cof")); 
   mc.SetObservables(*w.var("x"));  

   w.defineSet("nuisParams","a,nsig,nbkg");
   mc.SetNuisanceParameters(*w.set("nuisParams") );

   // these are needed for the hypothesis tests
   mc.SetSnapshot(*w.var("cof"));
   // need now to set the global observable
   mc.SetGlobalObservables(*w.var("b"));

   mc.Print();
   // import model in the workspace 
   w.import(mc);


   ///~~~~~~~  End of creating the ModelConfig object and set "b0" as a global observable ~~~///

  // import a tree
 
  TFile *treefile = TFile::Open("energyDepositedLess1keV.root");
  TTree* tree = (TTree*) treefile->Get("ntuple");

  // Define observables x
  RooRealVar x("x","x",1,0.021,10) ; // "1" is the initial value of x.

  // Import only observables (x)
  RooDataSet ds("ds","ds",*w.var("x"),Import(*tree)) ; ///refered from rf102_dataimport.C
  ds.Print() ;
    ds.add( *w.var("x"));


  RooPlot* frame3 = x.frame(Title("Recorded energy in CCDs")) ;
  ds.plotOn(frame3) ;

  TCanvas* c = new TCanvas("Recorded energy","Recorded energy",800,800) ;
   gPad->SetLeftMargin(0.15) ; frame3->GetYaxis()->SetTitleOffset(1.4) ; frame3->Draw() ;


   w.import(ds);

   w.Print();

   TString fileName = "CountingModel.root"; 

   // write workspace in the file (recreate file if already existing)
   w.writeToFile(fileName, true);

}

Hi,

You have posted the code and not the workspace. Also to run the code I need the source code for your user-defined pdfs, which are not part of RooFit.

Concerning the result you are getting, I see no real dependency of CLs+b on the parameter you are scanning. In order to estimate an interval it should increase (for getting a lower limit) or decrease (for an upper limit), because as you move your parameter of interest the model should become more or less compatible with the data.
If CLs+b does not change, it means your model is not much sensitive to your parameter of interest. So either the model is wrongly configured or you are scanning a too small region.

If you are doing a fit of your “conf” parameter in the observed data, what is the best fit value and its estimated error ?

Best Regards

Lorenzo

Hi, Lorenzo,

Thanks for reply !

I agree with you that, to set a limit, the CLs+b should have a kind of tendency of changing along with the increase or decrease of “cof”. Which isn’t the case of my plot.

All of the macros related to this analysis are attached here.
The model is kind of well-known. While the data(observables) are variant a lot depending on experiments.
For our data, there also exist different selections, though a very primary check shows no big difference.

I will check further on other data selections.


As to the scan range, I actually started with a big range[1e-5,1e-2], but can't find cof value could reach the 90% confidence line, so I decrease the scanning range down to the current one which is [1e-5, 1e-4].

The plot is the scanning of range [1e-5, 1e-2]. Apparently, from here there is no cof value reached the 90% CL line.
<img src="/uploads/default/original/2X/6/64ffaa958d347aa32f7fb9efd7df4c6c1fe13b8a.png" width="690" height="463"><br/>

As to the best fit of "cof", it's supposed to the order of 1e-5.
If yes, then it consistent with the result of another collaboration.

~~~~~~~~~~~~~~~~~~~~~~~~~~~~~~~~~~~~~~~~~~~~~~~~~~~

A technical question, to set an interval(instead of a limit), can I just change the line in the exercise 7 of this page, 
[twiki.cern.ch/twiki/bin/view/Ro ... mits_using](https://twiki.cern.ch/twiki/bin/view/RooStats/RooStatsTutorialsJune2013#Exercise_7_Compute_Limits_using)
from
[code]
 if (useCLs) profll.SetOneSided(true);
[/code]
to
[code]
 if (useCLs) profll.SetOneSided(false);
[/code]


Thanks !

Best,
Junhui
<a class='attachment' href='/uploads/default/original/2X/7/7db7c595daa24eea9fa1a2e90dabb1de76894969.gz'>setLimit.tar.gz</a> (14.9 KB)