Hi all
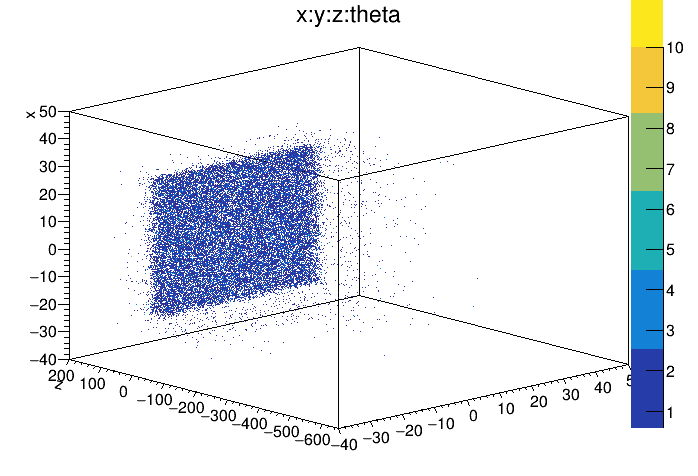
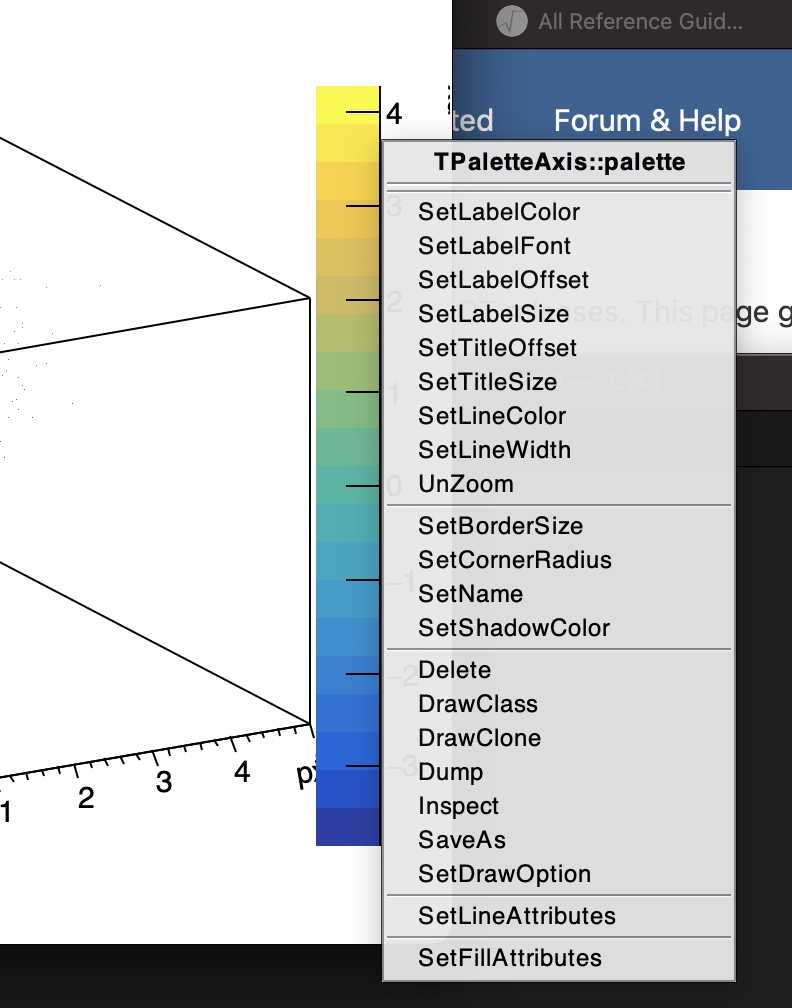
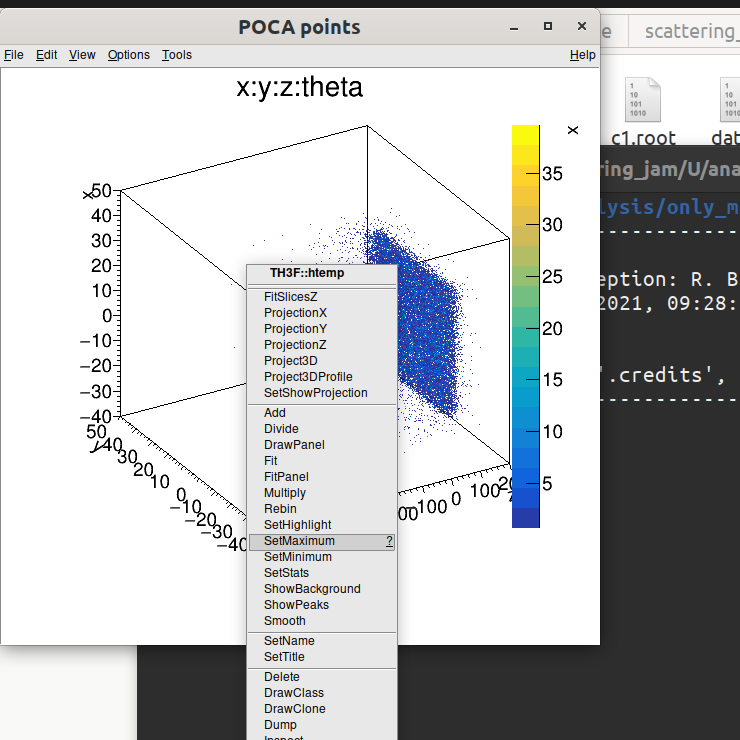
I have a 4-column data and want to plot a 4d graph (3d + color). I am using tree and tree->Draw(“x:y:z:theta”,"",“COLZ”); but the color bar cannot be customized. Please help me if there is any other option or is it possible to edit the graph?
Thank you in advance.
ROOT Version: Not Provided Platform: linux Compiler: Not Provided
I see. This TH3 is just created to draw the frame. When you draw a tree with 4 variables and option col the data are un-binned. A dot is drawn at each point. This setting has no effect.