Dear experts,
can you explain me why using these 4 methods to compute a chi2 between an histogram and a pdf gives 4 differents results and only one is close to the expected one (100 bins)
nbviewer.ipython.org/gist/wiso/4 … 3fd7226e4b
thank you
Dear experts,
can you explain me why using these 4 methods to compute a chi2 between an histogram and a pdf gives 4 differents results and only one is close to the expected one (100 bins)
nbviewer.ipython.org/gist/wiso/4 … 3fd7226e4b
thank you
Hi,
There is no universal definition of a chi2, just to name two, one is the Pearson chi-square the other is the Neyman, due to the different wy of considering the errors. In addition you could add also the arbitrary way of dealing with empty bins. So I am not surprise you get different results.
In the limit of infinite statistics probably the different definitions will give the same results.
Best Regards
Lorenzo
Hello Lorenzo,
thank you. By the way how can I know which definition is implemented? In addition, don’t you think the numerical difference is quite big?
I repeated your calculations in 2021, and the numbers are very similar. This is a pity, because Chi2 is a known distribution with well defined properties. It is used to determine the goodness of fit (through the p-value).
When I calculated chi2 in a real analysis, the value for chi2 from plot was very different (it is known that it is not accurate, it’s added to its docs), while the values for RooChi2Var and createChi2 were similar up to 1%.
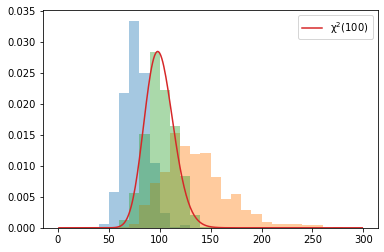
However, as I said, for your script there were no changes (so this is not the case of improved algorithms). I’m copying it here with slight updates for Python 3. The plot is similar to yours (without a green bin near zero).
chi2_problem.py (1.5 KB)