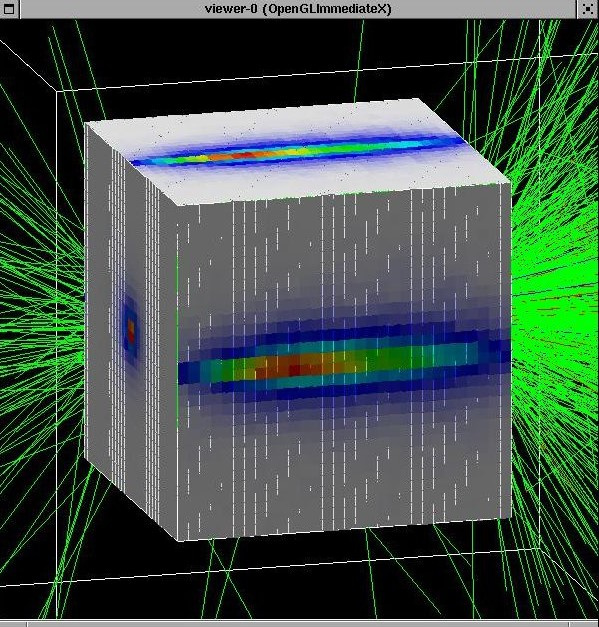
Hello, is there a way to merge 3 TH2F plots in a single one like this ?

Thank you
Please read tips for efficient and successful posting and posting code
ROOT Version: 6.20/24
Platform: Windows 10
Compiler: VS2019
Hello, is there a way to merge 3 TH2F plots in a single one like this ?
Thank you
Please read tips for efficient and successful posting and posting code
ROOT Version: 6.20/24
Platform: Windows 10
Compiler: VS2019
Your plot look more a TH3:
https://root.cern/doc/master/classTHistPainter.html#HP25
thank you @couet but in the TH3F I can use just 3 variables…I’ve 4 variables (x-y-z coordinates and the released energy).
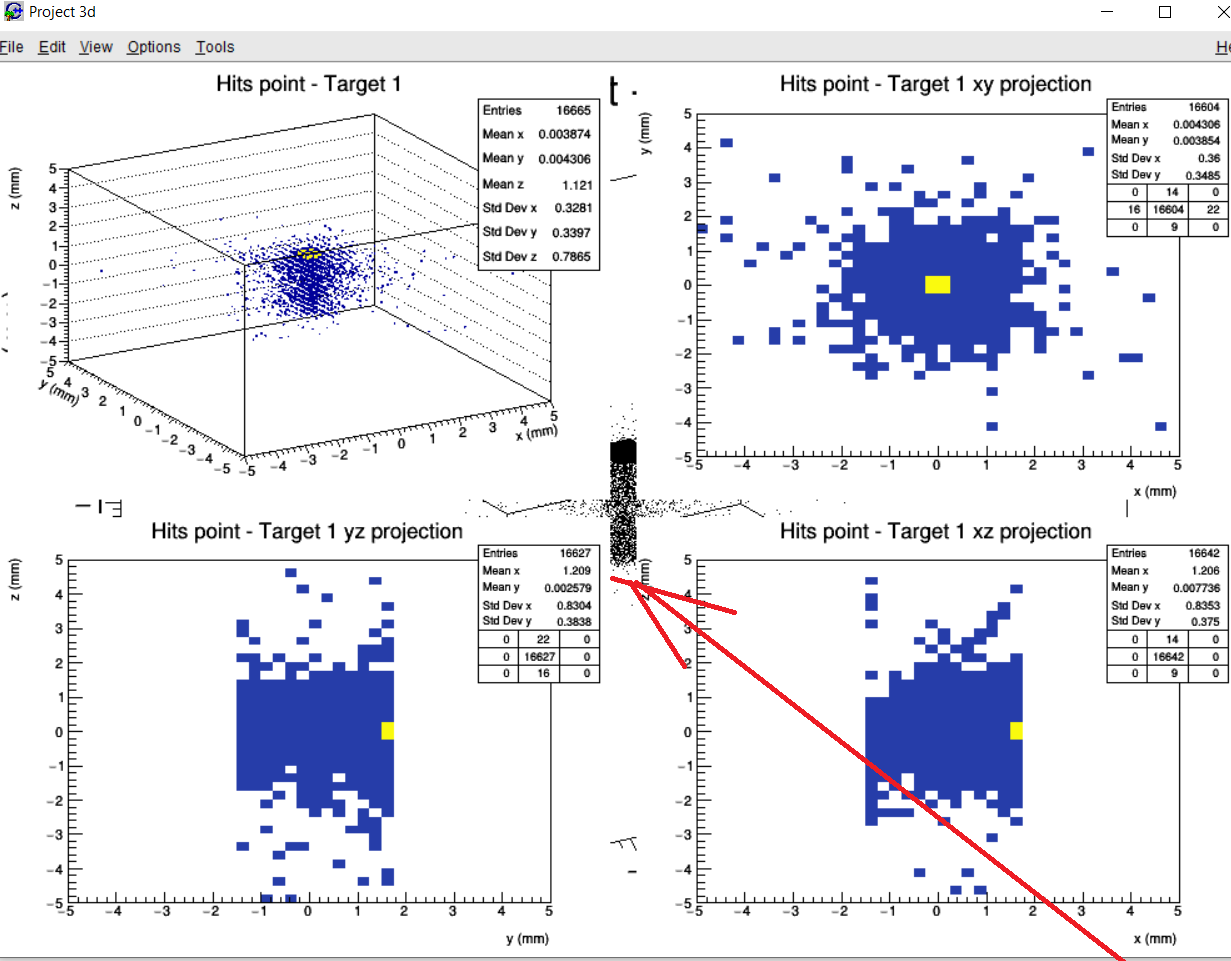
I guess the question is how to draw three 2D projections (of something) on three “faces” / “sides” of a cube.
Well a TH3 has x y z and bin content …
Thank you the both @couet and @Wile_E_Coyote.
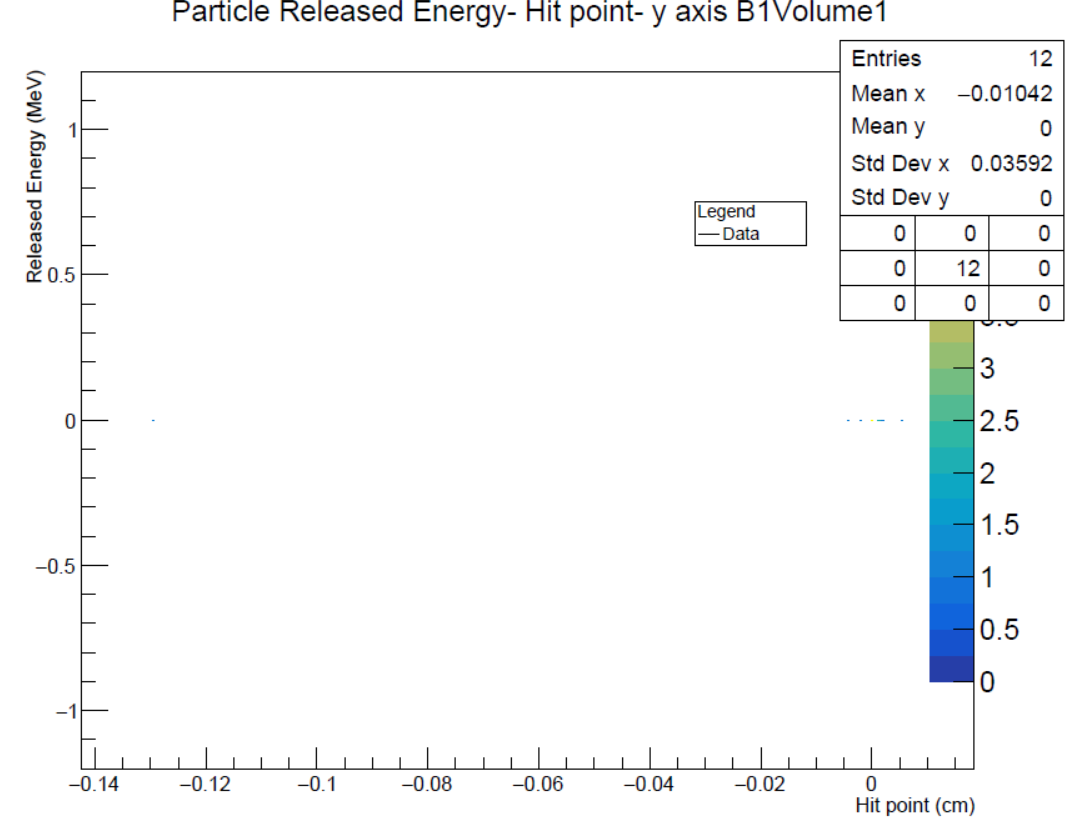
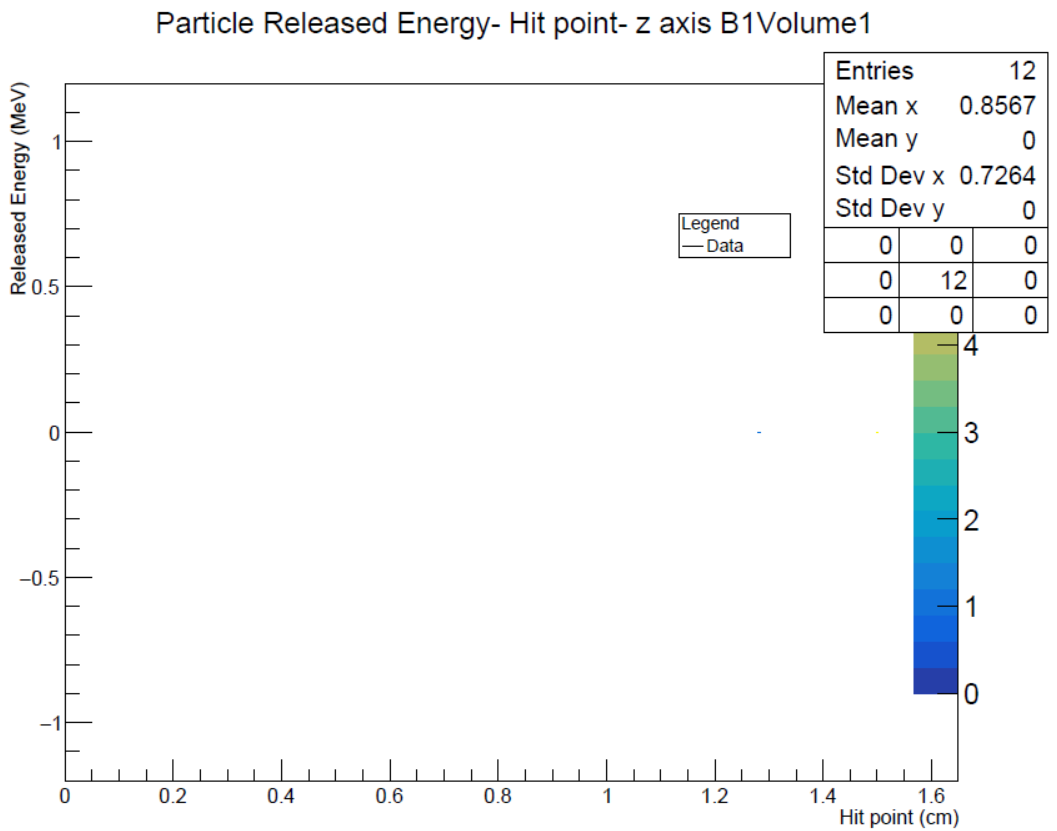
@couet yes, the TH3F has 3 bin contents…but I need to release each coordinates to the released energy. For exaxmple, now I have the three graph (just few events, because I’m just testing the Geant4 code working)
the x hit point vs the released energy
I would like to know if ROOT allows to merge the three canvas in a single one like this one
No … there is no direct way to do that from 3 canvases.
may something like this?
Otto
Thank you @OSchaile, I think that by this macro just reletes th x-y-z coordinates (i.e. 3 variables) and not 4… anyway, I looked it and it’s a nice way to show results about the hits point…Unfortunately I tried to modify the macro to get data from my root file…but it doesn’t work fine…
Here the macro and the Root file
B1.root (35.8 KB)
proj3d.C (7.2 KB)
Hi,
A TH3 is in fact a 4-tuple: x, y, z, c (bin content)
Dont you want to weight your entries with the “ReleasedEnergy”?
Are you sure about this line (y appears twice):
("EndStepPos.z : EndStepPos.y : EndStepPos.y >> h3DHit")
Otto
Thank you @OSchaile
Yes! Obviously! If it’s possible to weight the entries according to the Released Energy, I want to do it, because I need to study the released energy. How can I do it?
Yes sorry it was just a mistake! This line is the correct one
TString varh3 = TString::Format("EndStepPos.z : EndStepPos.y : EndStepPos.x >> h3DHit");
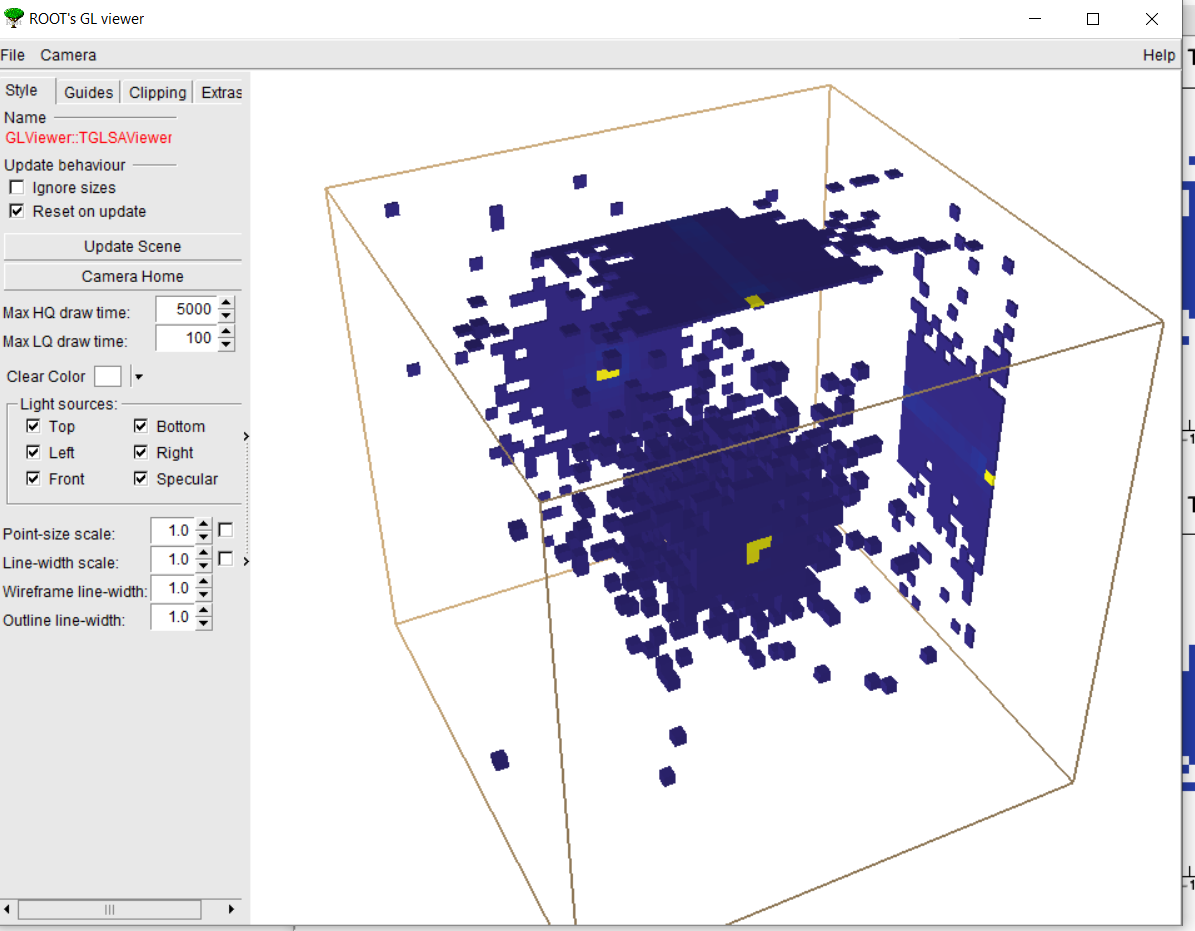
Now I get the projections but you see, in the ROOT’s GL viewer the points are out of the axes …
Here the ROOT file WeTransfer - Send Large Files & Share Photos Online - Up to 2GB Free
and here the macro proj3d.C (7.9 KB)
Hi,
my original example had equal x,y,z ranges, therefore a bug
in the code was hidden. (May be you find it)
Until this is fixed you might try with forced
equal ranges:
TH3F *h3 = new TH3F("h3DHit", "", 40, -5., 5.,40, -5.,5.,40,-5.,5.);
Btw the macro you att has still y twice
Otto
Thank you @OSchaile
Where do you see the y twice?
I just downloade it and I read
TString varh3 = TString::Format("EndStepPos.z : EndStepPos.y : EndStepPos.x >> h3DHit");
then no twice…
Thank you! this solved !
Instead, how can I weight for the relaesed energy as you wrote in your previous message?
In TTree:Draw one can do:
t1->Draw("EndStepPos.z : EndStepPos.y : EndStepPos.x : ReleasedEnergy>> h3DHit");
as desribed in:
https://root.cern.ch/doc/master/classTTree.html
This generates the plot but the projections are empty!
I am afraid the result isnt a real TH3( @couet)
I guess one needs to do it “by hand” i.e.loop on entries and
Fill (Double_t x, Double_t y, Double_t z, Double_t w)
Otto
just in case you are not experienced with root:
proj3d_faca87_1.C (7.4 KB)
B1Volume1.C (1.5 KB)
B1Volume1.h (5.6 KB)
read the comments in B1Volume1.C and .h and run it with:
root [0] .L B1Volume1.C+
Info in <TUnixSystem::ACLiC>: creating shared lib...
root [1] auto b1v=new B1Volume1()
(B1Volume1 *) @0x7ffd420d1288
root [2] b1v->Loop()
root [3] .L proj3d_faca87_1.C+
root [4] TFile *f = new TFile("B1Volume1_out.root");
root [5] TH3F *h3 = (TH3F*)f->Get("h3DHit");
root [6] proj3d(h3)

Note: you need the new proj3d_faca87_1.C

OttoThank you @OSchaile if the projections are empty…I think it’s better to use this macro just for the hit points and to show the relation hit point - released energy by using the TH2F
Two more questions please
I think it’s the TH3F… is there a way to not show it?
HI,
1.
to get rid of the underlying TH3-plot you should use option goff:
t1->Draw("EndStepPos.z : EndStepPos.y : EndStepPos.x>> h3DHit","","goff");
In the “Guides” menu in the GL viewer you can chooses “Axes”
but that isnt very satisfactory
Otto
I found the bug:When drawing the zy and zx projections the
axises of xy were used, if all ranges are same this doesnt
matter.
So one needs to add :
// draw zy proj at right side, fixed x
   xa = projyz->GetXaxis();
   ya = projyz->GetYaxis();
and
// draw zx proj at back side, fixed y
   xa = projxz->GetXaxis();
   ya = projxz->GetYaxis();
Otto
to get rid of the underlying TH3-plot you should use option goff:
t1->Draw("EndStepPos.z : EndStepPos.y : EndStepPos.x>> h3DHit","","goff");