Dear Experts,
I am trying to evaluate a function F(x, costheta) and then plot it in 3D. For this, I used:
TH2D \*S0 = new TH2D(“S0”, F vs x costhta; x_f; cos(#theta)”,
20, 0.1, 1, // x_f range
20, -1,1);// cos(theta) range
I fill the histogram with: S0->Fill(x_f, cosTheta, F); and plot it using: S0->Draw("Surf1");
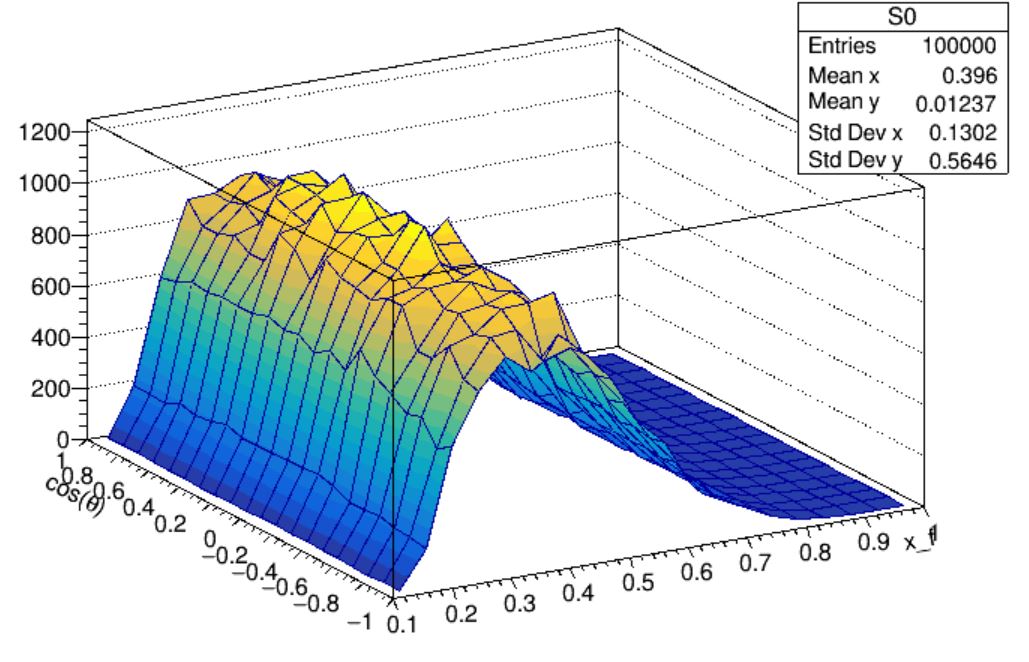
The plot on the Z axis results in a large value of F (around 120, magnitude).
However, when I plot F against either x or cosθ using the following definition of the histogram:
TH2D *S0_Dim = new TH2D(“S0_Dim”, " F vs csotheta ",
I obtain a reasonable magnitude, which I expect from my function.
I’m not quite sure why, but when I try to view the 3D plot, the Z-axis (which represents the magnitude of F usnig ) shows higher values!
Best,
Mustapha
Hi @Mustaphaa ,
Thank you for your question, I will ask @couet for some help here.
Cheers,
couet
October 30, 2025, 9:33am
3
Can you post a small script reproducing this issue ?
here is the script:
// Function_Theta imple ...
void Function(){
Double_t energy, cosTheta;
ch1->SetBranchAddress("energy", &energy);
ch1->SetBranchAddress("cosTheta", &cosTheta);
TH2D \*S0 = new TH2D("S0", "F vs xf Costheta; x_f; cos(#theta)",
20, 0.1, 1, // x_f range
20, -1,1);// cos(theta) range
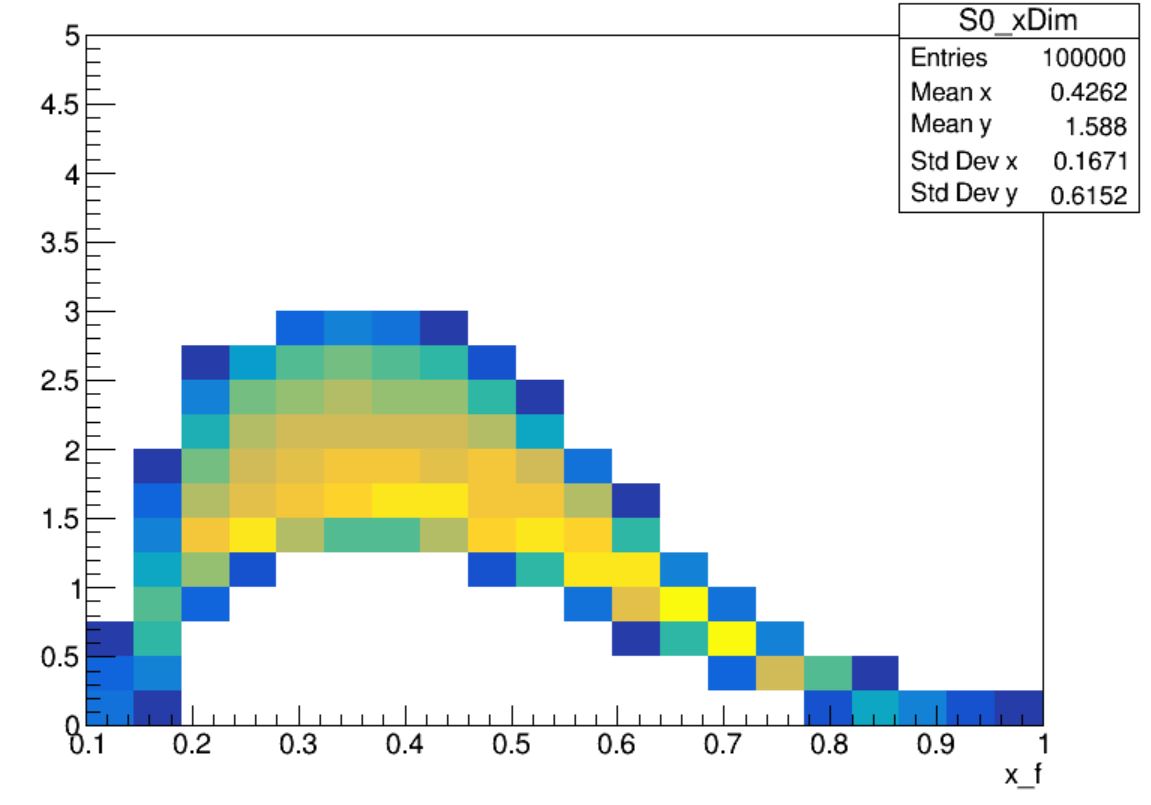
TH2D \*S0_xDim = new TH2D("S0_xDim", "F vs x_f; x_f; ",
20, 0.1, 1, // x_f range
20, 0,5);
for (Long64_t ientry = 0; ientry < ch1->GetEntries(); ientry++) {
ch1->GetEntry(ientry);
double x_f = (2\*(energy/mtop)\*std::sqrt((1-beta_val)/(1+beta_val)));
double F = Function_Theta(x_f, cosTheta);
S0_xDim->Fill(x_f, F);
S0->Fill(x_f, cosTheta, F);
}
S0_xDim->Draw();
}
and the full script :
Full_Script.c (7.2 KB)
and the data used can be found in : CERNBox
couet
October 30, 2025, 11:52am
5
I cannot run your script because I do not have the data file, but I see there is no 3D plot in your code. You do:
S0_xDim->Draw();
This will produce a 2D color plot. To get a 3D plot you will need to use one of the LEGO of SURF options.
sorry ,
the S0_xDim was used to see if the magnitude is same as in 3D plot.
couet
October 30, 2025, 12:12pm
7
So what is wrong with S0->Draw(“surf1“); ? as I said I cannot run you script.
If you want to draw your “Function_Theta” function, try:
TF2 *f =
  new TF2("f",
          [](const double *x, const double */*p*/) { return Function_Theta(x[0], x[1]); },
          0.1, 1., // x_f range (i.e., x[0] above)
          -1., 1., // cos(#theta) range (i.e., x[1] above)
          0); // no parameters (i.e., p[...] not used above)
f->SetTitle("Function_Theta;x_f;cos(#theta)");
f->Draw("surf1z"); // e.g., "surf1", "surf1z", "lego2", "lego2z"
The issue is that I get different magnitude of my function when using a 3D plot, as can be seen here:
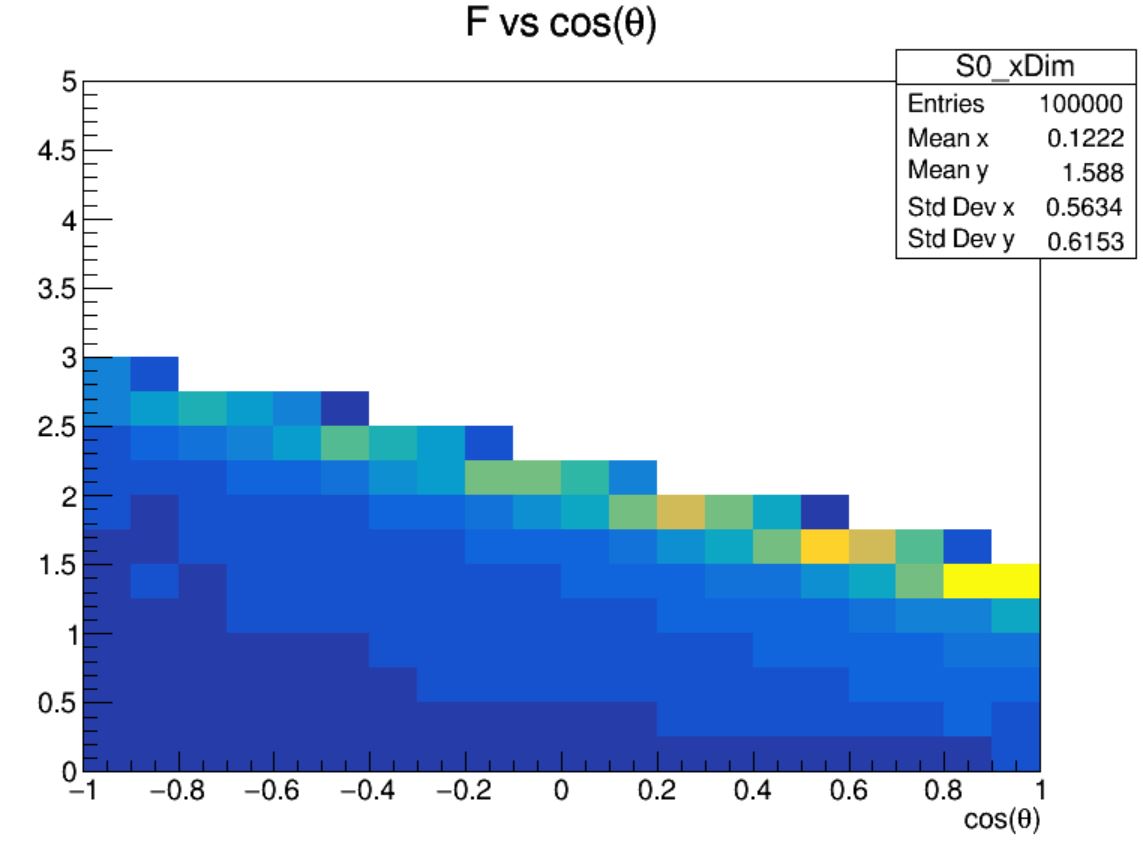
when plotting 2D like F vs costheta or F vs x_f, the magnitude obtained is around <=3.5 as as I showed in the previous plots.
i put the data in the eos, if you have acces please let me know.
I’m not sure what you mean by magnitude, but I suppose you mean the colours? Since you don’t include above the colour scales, we cannot tell how one is higher than another. Anyway, from your first post it seems that you are using different bin sizes, so that would explain the different bin contents.
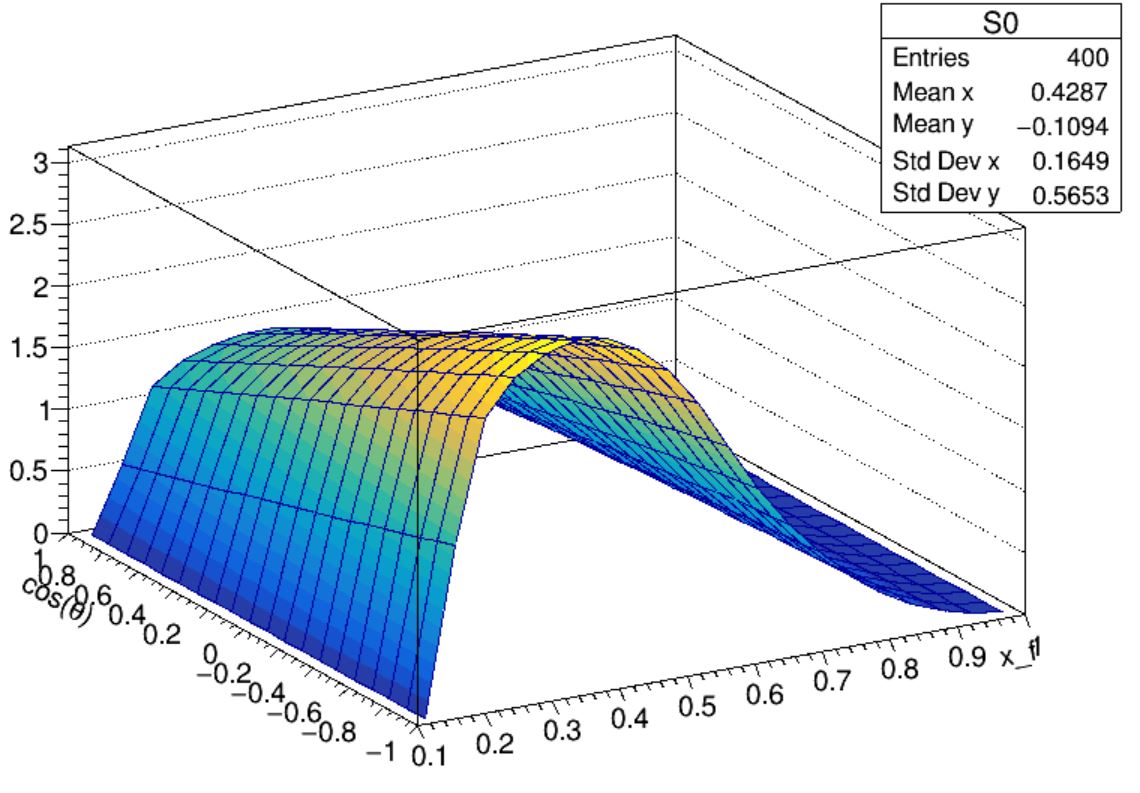
Sorry for the confusion. I have evaluated the functionL Function_Theta(x_f, cosTheta) using a grid of points as follows:
for (int i = 0; i < S0->GetXaxis()->GetNbins(); i++) {
    double F = Function_Theta(bin_X_axis, bin_Y_axis);
    S0->SetBinContent(i+1, j+1, F);
 }
}
and i got the following plot :
However when i use my actual data, I don’t see the same value on the Z-axis, which is around 3 (that’s what I mean by magnitude), for cross-check i drew F vs either x_f or costheta it gave that value (~3.5) using my data..
couet
October 30, 2025, 2:09pm
12
I tried to access your data without success…
In your “Full_Script.c” macro, “S0” bins are filled multiple times (in the for loop): S0->Fill(x_f, cosTheta, F);S0->Fill(x_f, cosTheta, 1.);
couet
October 30, 2025, 3:23pm
15
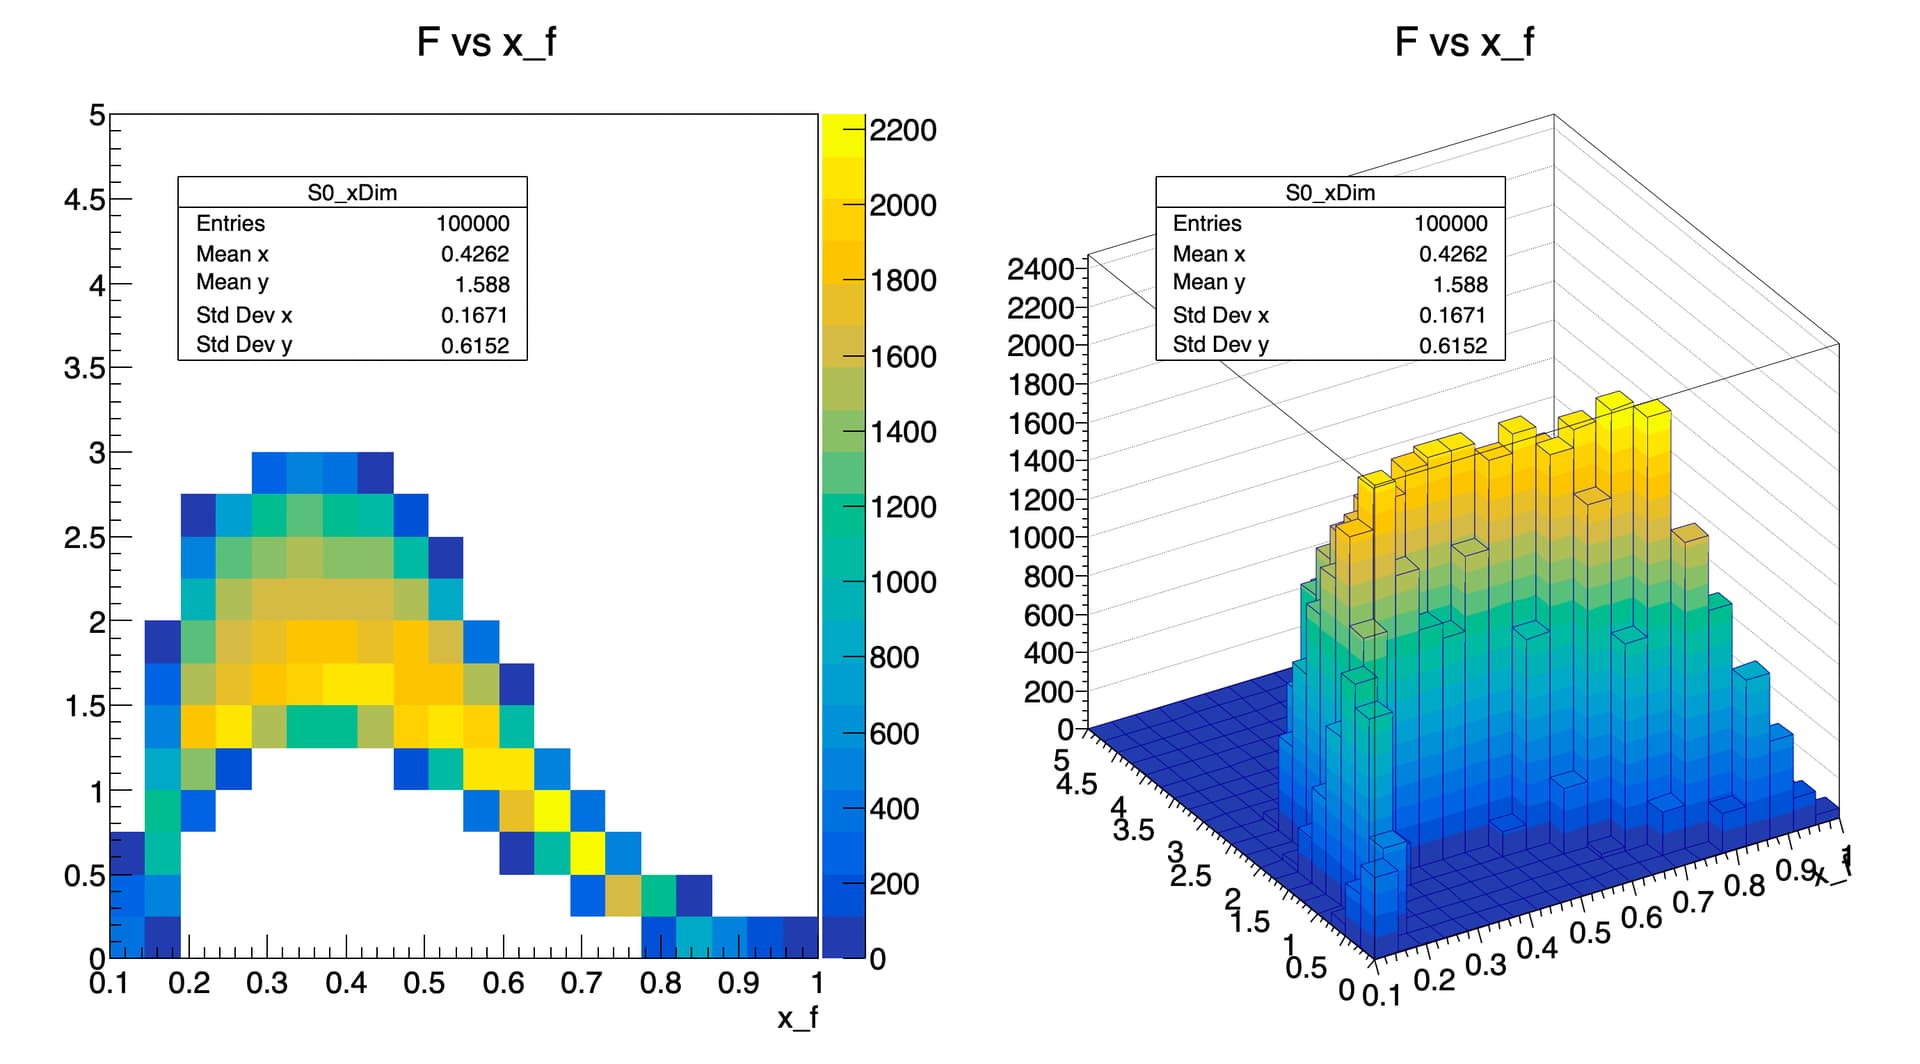
I got your file. For a comparison between the 2D and 3D plot I changed the plotting part of your script to:
auto C = new TCanvas("","",1000,800);
C->Divide(2,1);
C->cd(1); S0_xDim->Draw("COLZ");
C->cd(2); S0_xDim->Draw("LEGO2");
This gives me the following plot. You seem to be happy with the left plot. The right plot (in 3D) is the same. So I do not see what is special with 3D and why you said “I get different magnitude of my function when using a 3D plot” .
Thanks, that was my confusion between the two plots as I was comparing my plot (the left one) with a reference one!