Is it possible to draw a TH3F using colors to represents the value in the bin, the same way it is done with TH2F using “colz” ?
I know the option “glbox” but colors look better to me and I couldn’t get hte “colz” work for me.
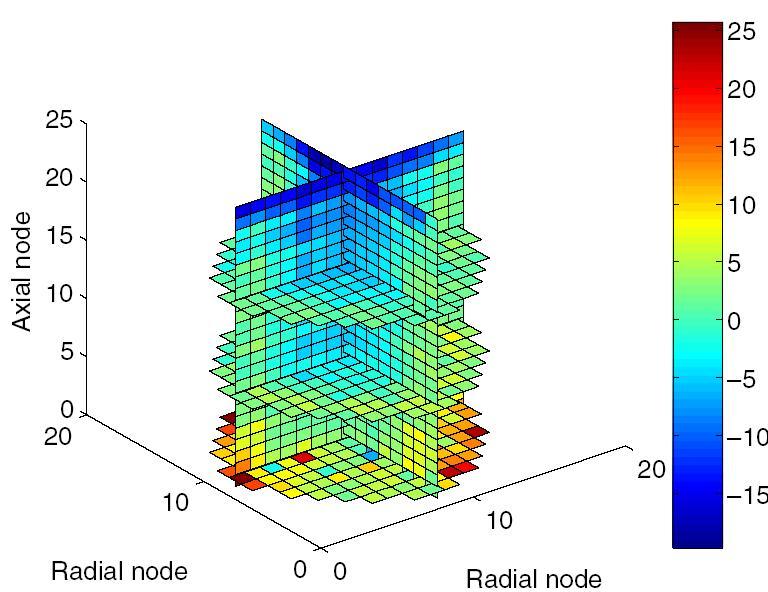
I have attached a picture that represent what I would like. Starting from a full TH3F and using a script I could generate another TH3F filling cells with 0 to emulate slicing.
Then can this be a suggestion to have this kind of plot for a next release of ROOT? The picture I have shown come from Mathlab, and it would be very nice to have this kind of representation in ROOT.
It looks better (meaning easier for interpretation) that the “bubble plot” available in TH3F.
I agree with matthieuguillo: it would be nice to have the possibility to display TH3 slices with the “colz” option.
As reported in https://root.cern.ch/doc/v608/classTHistPainter.html (paragraph “Plot specific interactions (dynamic slicing etc.)”) it is possible to plot slices but they are shown with a “cont” option that might blur the image.