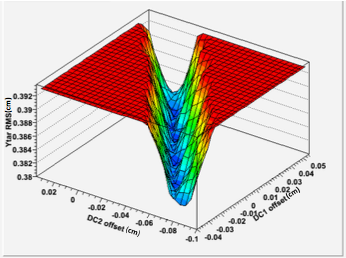
I am trying to plot 3 variable in 3D histogram. I am reading the x, y and z values from text files, then filling the 3D histogram. I want the output to be similar to the picture attached, but I couldn’t find any drawing option for 3D that will give the same result. Any suggestions?
I assume you are referring to a TH3, when you say a 3D histogram? This object actual represent four variables, x, y, z, and a value at the point. I believe you want a TH2, which would accept x, y, and a value of z. THistPainter will then support the SURF1 option for a TH2 as indicated in your figure. https://root.cern.ch/js/latest/examples.htm#th2_surf1