Hi all,
I’ve made a 3d histogram from an RDataFrame, drawn with the lego2 style along with a colorbar to emphasize the scale of the “fourth dimension”. However, I’d like to make this colorbar’s scale logarithmic.
Here’s the highlights of my (functioning) PyRoot Code:
The documentation I’ve found online for similar issues recommends the method c1.SetLogz(), and while this works for a 2D histogram, it seems to interfere with both the z-axis and the colormap in the 3D case.
“Interferes” how? Can you show what you get and what is wrong with it (what do you want to get)? A minimal working reproducer that we can run would also help.
By the way, note that if there are empty bins, the log scale may look strange, so you may want to do histo->SetMinimum(1) or some other small number, depending on your histogram. E.g.
{
   auto c = new TCanvas("c","c",1000,400);
   //c->SetLogz(1);
   c->Divide(2,1);
   gStyle->SetOptStat(kFALSE);

   auto h = new TH3F("h","h",5,-2,2,5,-2,2,4,0,4);
   double x, y, z;
   for (Int_t i=0;i<50000;i++) {
      gRandom->Rannor(x, y);
      z = x*x + y*y;
      h->Fill(x,y,z);
   }

   c->cd(1);
   gPad->SetLogz(1);
   h->DrawCopy("lego2z");

   c->cd(2);
   gPad->SetLogz(1);
   h->SetMinimum(1);
   h->Draw("lego2z");
}
Good catch on the singularity of log for empty binsl That actually partially solves the issue, but another persists. Below is my PyROOT code, and attached a small data file: example.root (1.6 MB)
import ROOT
#File name
rootFile = "example.root"

#Defining Canvas
c1 = ROOT.TCanvas( 'c1', 'A Simple Example', 200, 10, 700, 700 )

#Importing Root file
df = ROOT.RDataFrame("events", rootFile)

#Casting vectors back to strings, so that filtering works properly
df = df.Redefine("volume", "std::string(volume.data())")
df = df.Redefine("particle", "std::string(particle.data())")
df = df.Redefine("nextVolume", "std::string(nextVolume.data())")
df = df.Redefine("process", "std::string(process.data())")
df = df.Redefine("rz", "rz + 100")
#Defining the 3D histogram
gr = df.Histo3D(("graph", "Total Energy Deposition ",50, -25.0, 25.0, 50, -25.0, 25.0, 38, 80, 120),"rx", "ry" ,"rz", "Edep")
#Drawing
gr.Draw("LEGO2Z")

gr.GetXaxis().SetTitle( 'X (mm)' )
gr.GetYaxis().SetTitle( 'Y (mm)' )
gr.GetZaxis().SetTitle( 'Z (mm)' )

# c1.SetLogz()
c1.Update()
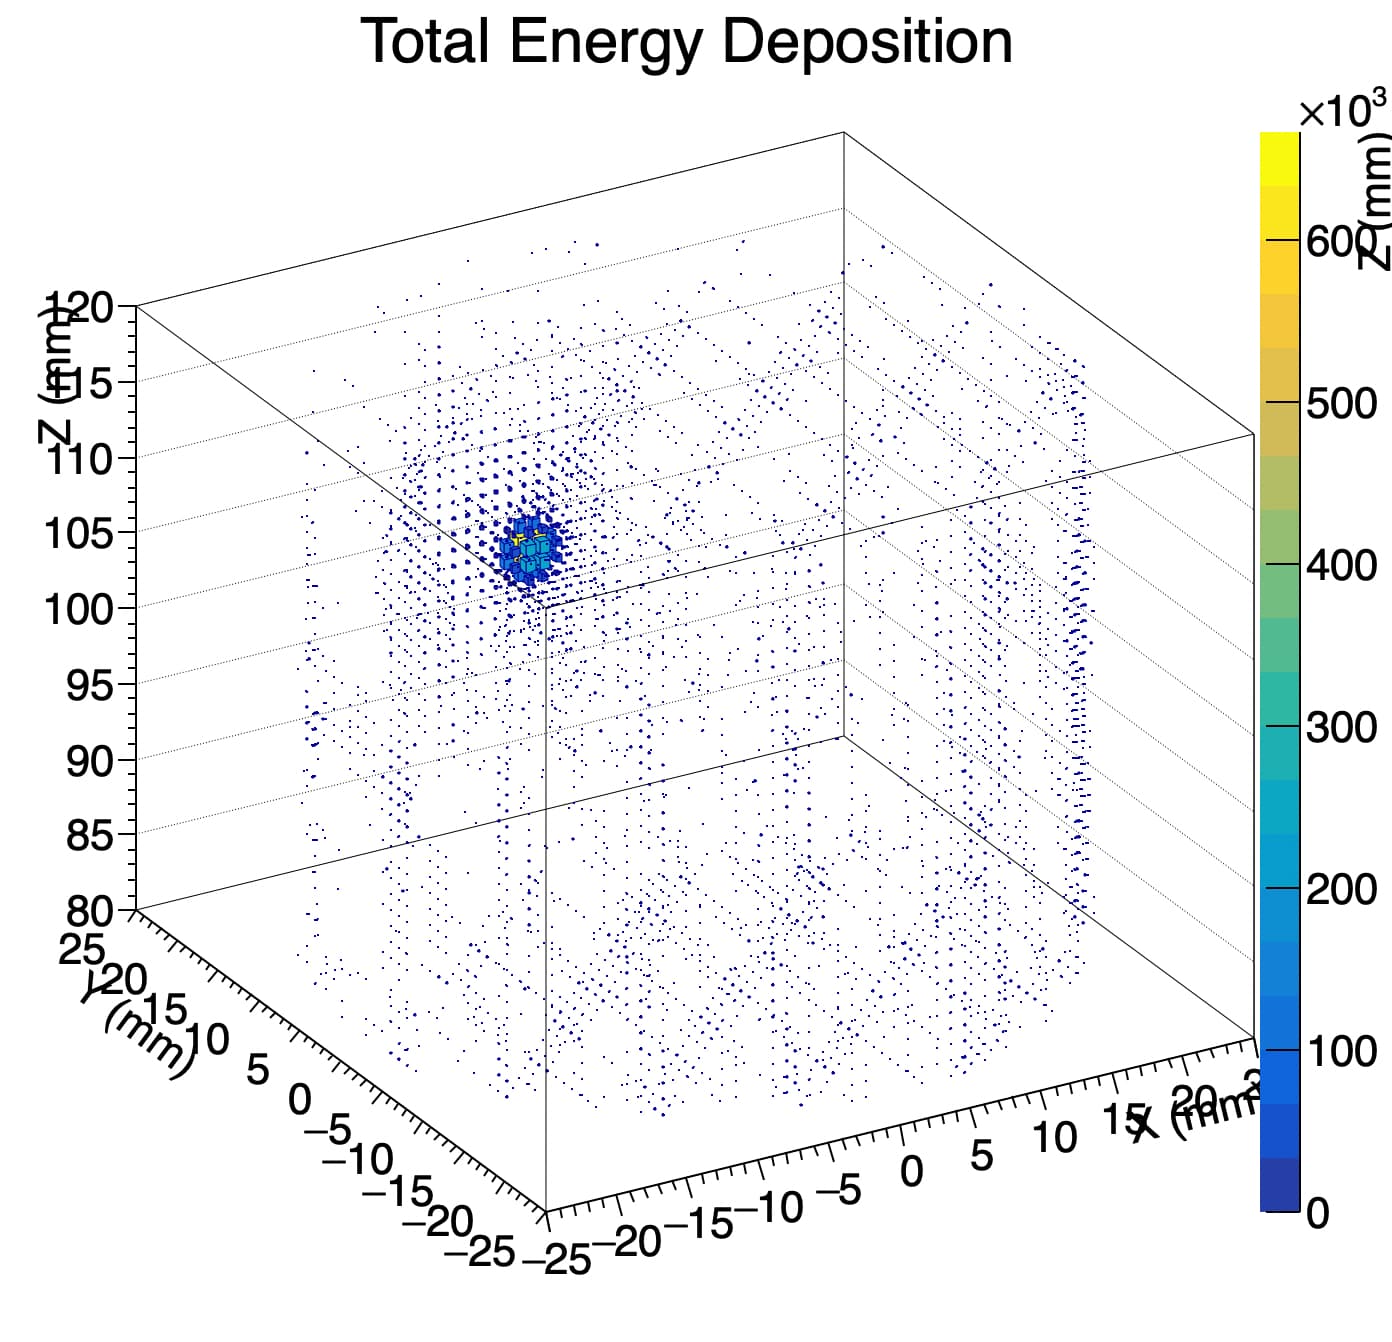
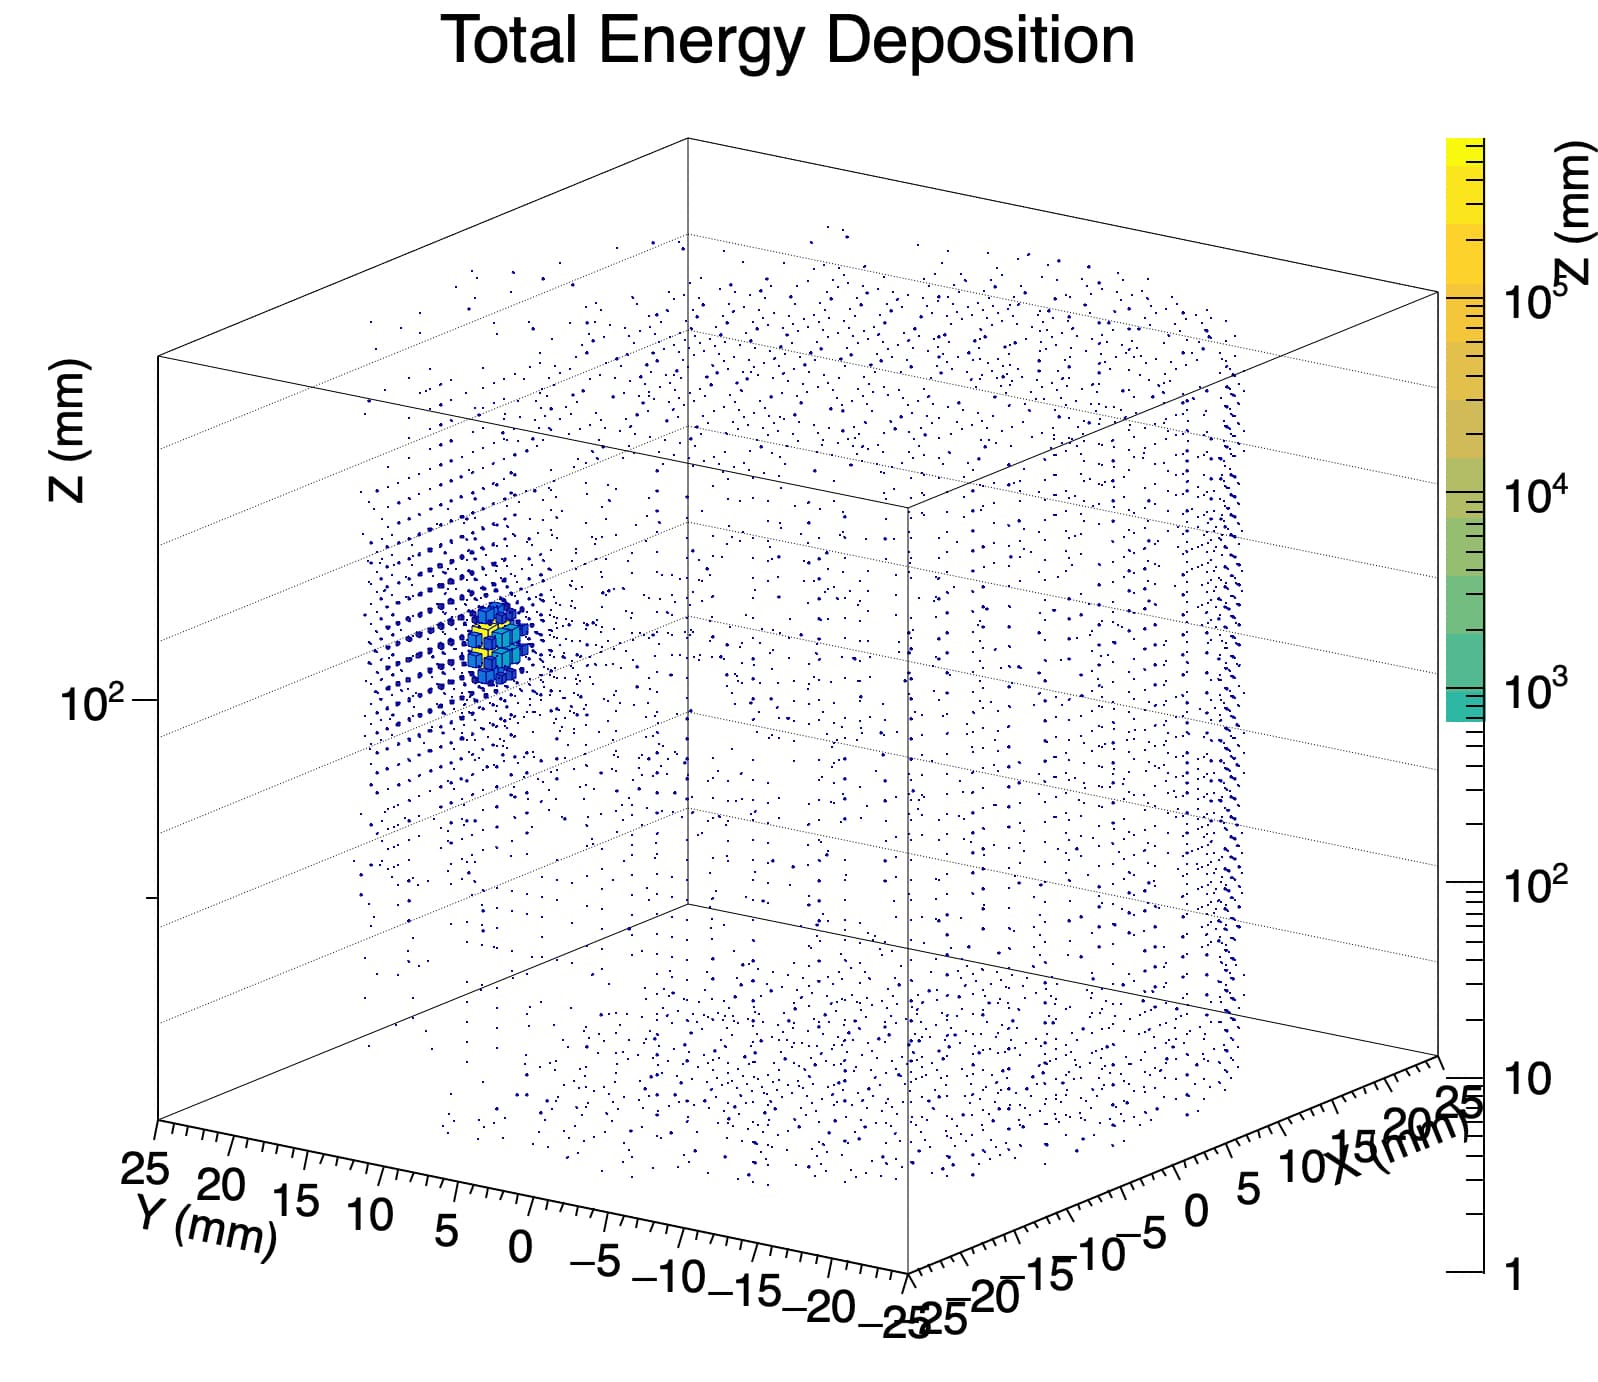
The two plots below are generated based on whether the line ‘’‘c1.SetLogz()’‘’ is left uncommented. Note that in the second plot, both the z axis and the color bar’s scales are logarithmic, despite the two axes conveying entirely different information. My goal is to have only the colorbar’s axis be log.
I’ll look but as @dastudillo said your Z axis starts at 0, which is not define in log scale. What about if you set a povisitive minimum ? does the white area in the color palette disapear ?