Hi,
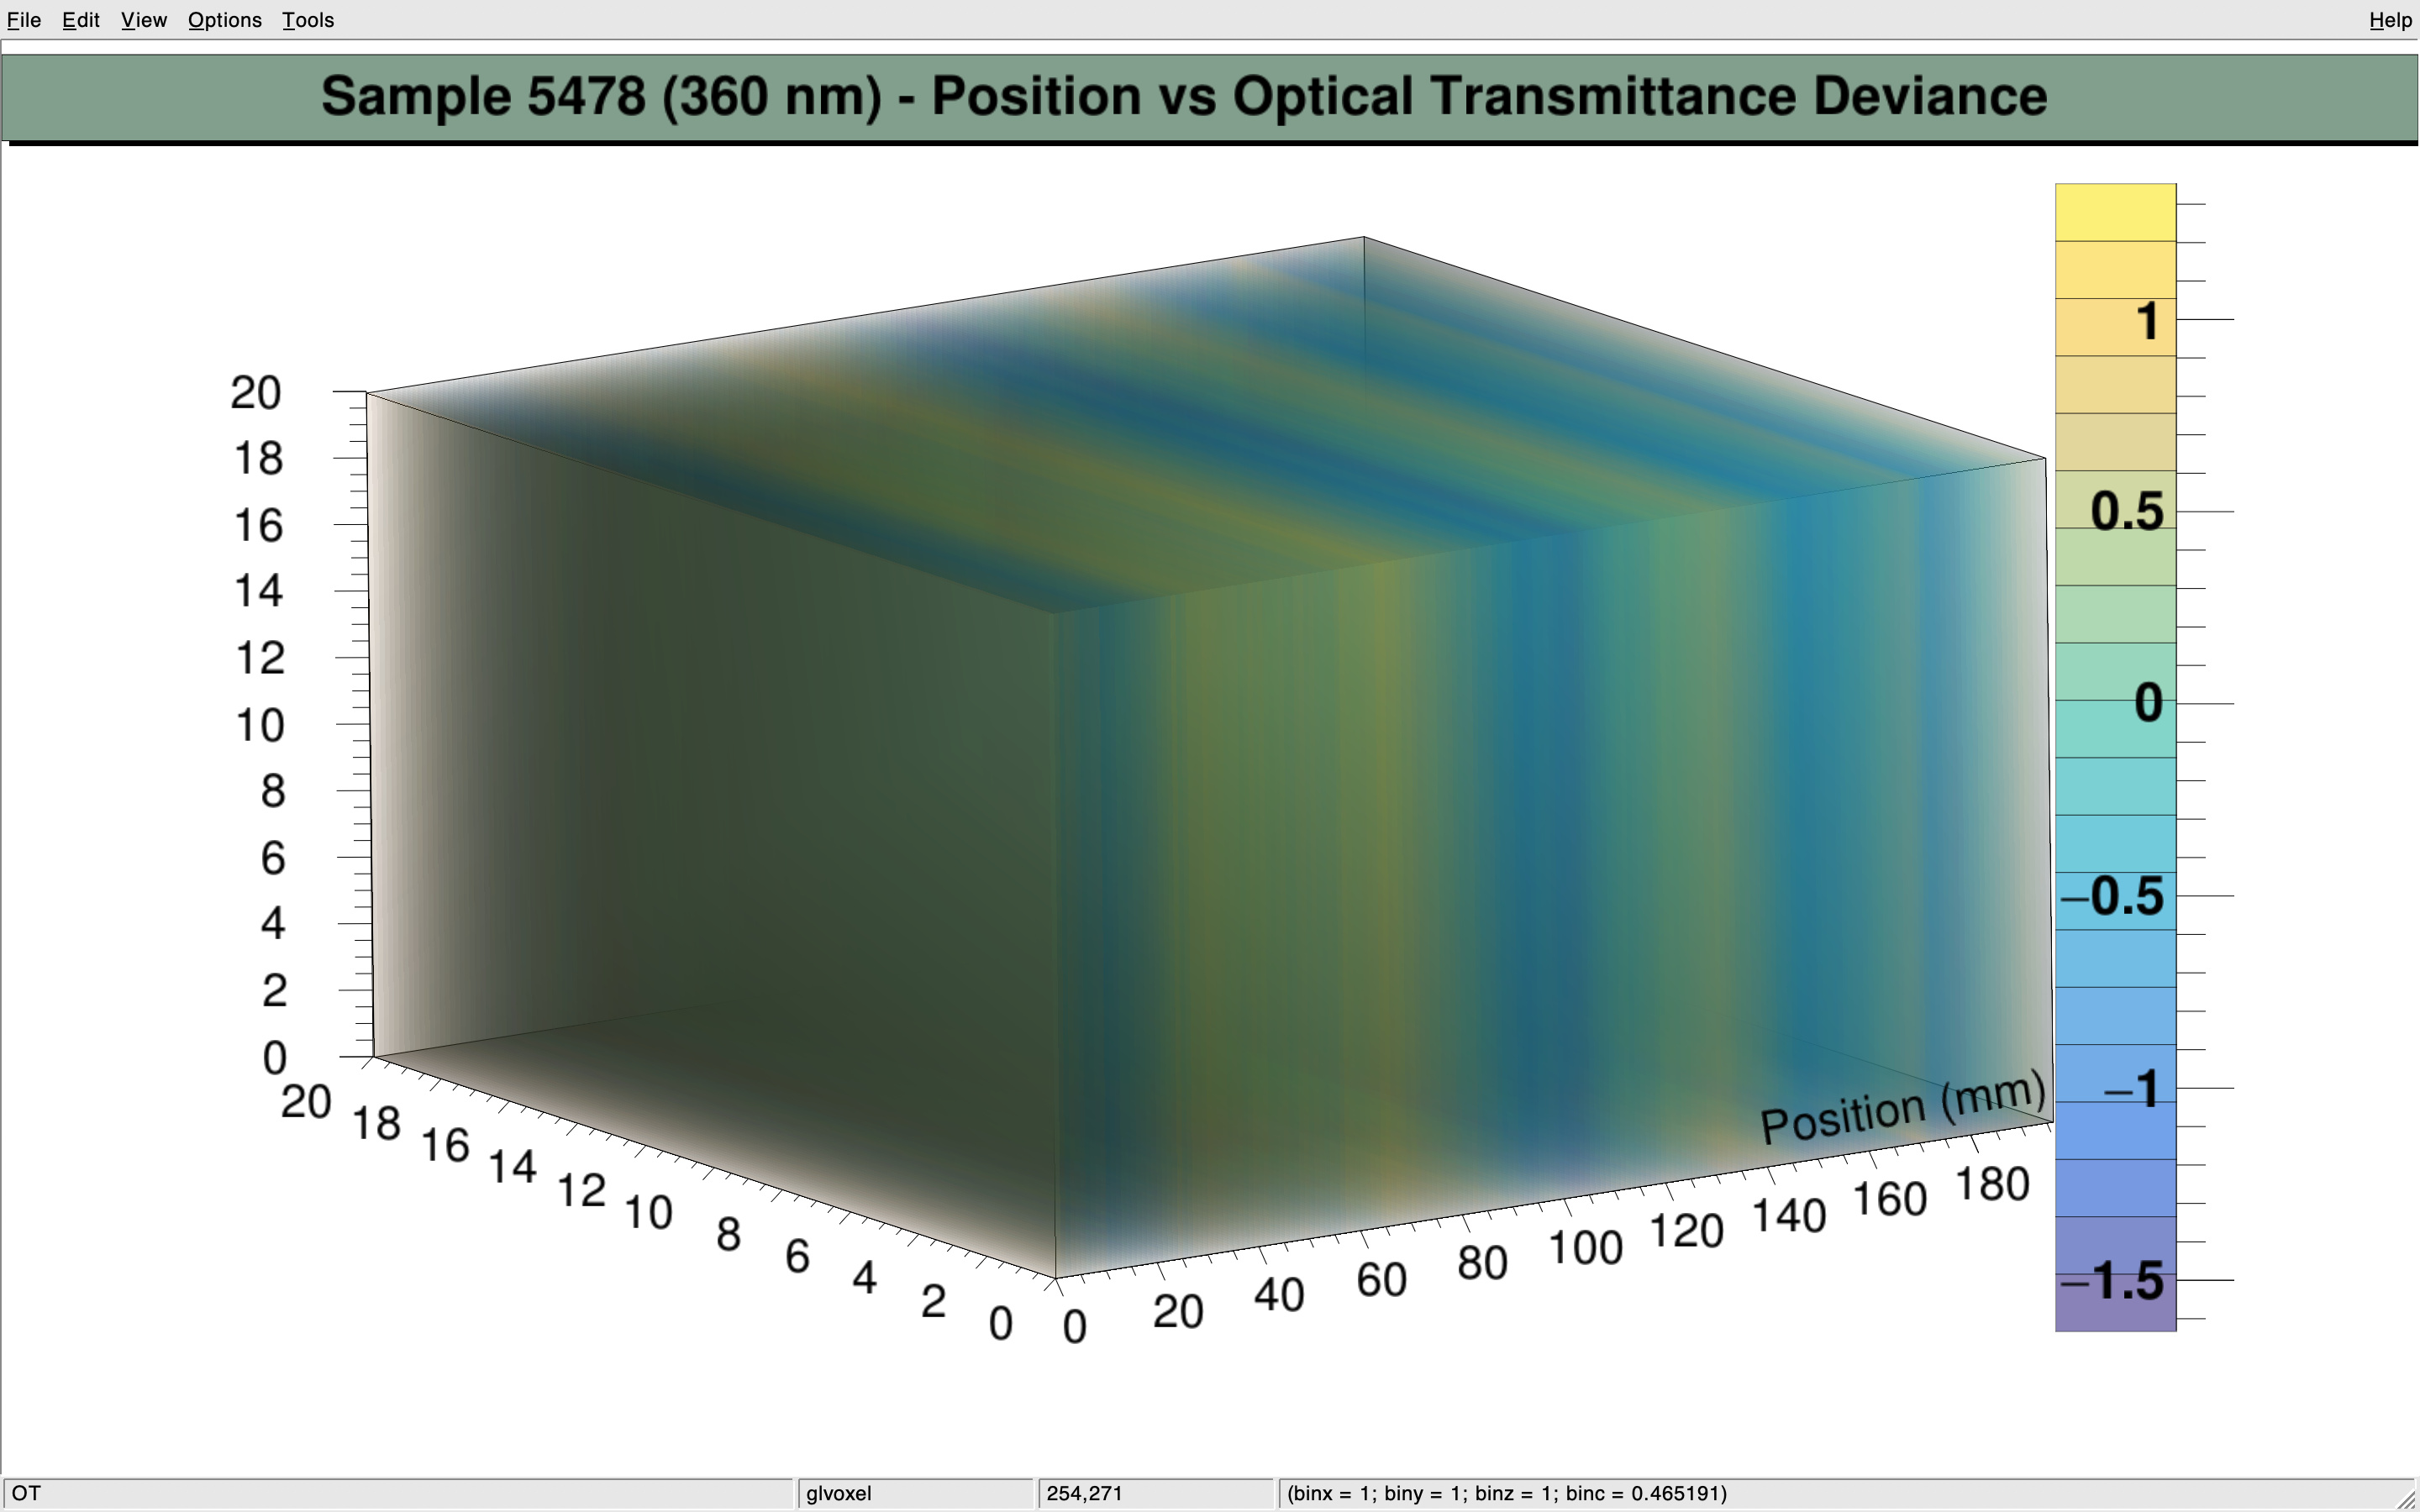
I’ve enclosed a photo of the 3D histogram. How do I label the colored bar?
Thank you so much!
ROOT v6.18 on MacOS 10.14.5
void sandbox(){

   struct input_t

   {
     Double_t transmittance;
   };

   input_t input;

   FILE *f = fopen("Crystal5478_360.txt","r");
   char line[400];

   Double_t transArray[196];

   Int_t j=0;
   TFile *file = new TFile("test.root","RECREATE");
   for(Int_t i;fgets(&line[0],500,f);i++){
    if (line[0] == '#'){
      continue;
    }else{
      sscanf(&line[0], "%lf", &input.transmittance);
    }

      transArray[j]=input.transmittance;
      j++;

   }

  float avg = 0.0;
  float sum = 0.0;
  int size;

  size = sizeof(transArray) / sizeof(transArray[j]);

 for (int i = 0; i < size; ++i){
   sum += transArray[i];
  }

  avg = ((float)sum)/size; //or cast sum to double before division

  Double_t dev[size];

  for(int i = 0; i < size-1; i ++)
  {
      dev[i]= transArray[i] - avg;
      //cout << "Deviance  " << dev[i] << "\n";
  }

   /*   for(int i = 0; i < 196; i ++)
  {

      cout <<  transArray[i] << "\n";
      }*/

   TH3F *hist = new TH3F("glvoxel", "Optical Transmittance", size, 0., size, 1, 0., 20., 1, 0., 20.);

   //Fill the histogram to create a "sphere". CHANGE THIS!!
   /*for (UInt_t i = 0; i < nZ; ++i) {
      const Double_t z = zMin + i * zStep;
      for (UInt_t j = 0; j < nY; ++j) {
         const Double_t y = yMin + j * yStep;
         for (UInt_t k = 0; k < nX; ++k) {
            const Double_t x = xMin + k * xStep;
            const Double_t val = 20. - (x * x + y * y + z * z);
            hist->SetBinContent(k + 1, j + 1, i + 1, val*100);
         }
      }
      }*/

   for (UInt_t i = 0; i < size; ++i) {
     hist->Fill(i,10,10, dev[i]);
         }


   hist->GetXaxis()->SetTitle("Position (mm)");
   hist->GetXaxis()->SetTitleOffset(-.5);
   //hist->GetWaxis()->SetTitle("Optical Transmittane Deviance");

   hist->SetTitle("OT");
   gStyle->SetCanvasPreferGL(1);
   hist->Draw("glcolz");

   TPaveLabel *title = new TPaveLabel(-1., 0.86, 1., 0.98,
				      "Sample 5478 (360 nm) - Position vs Optical Transmittance Deviance");

   title->SetFillColor(32);
   title->Draw();
}