Hi,
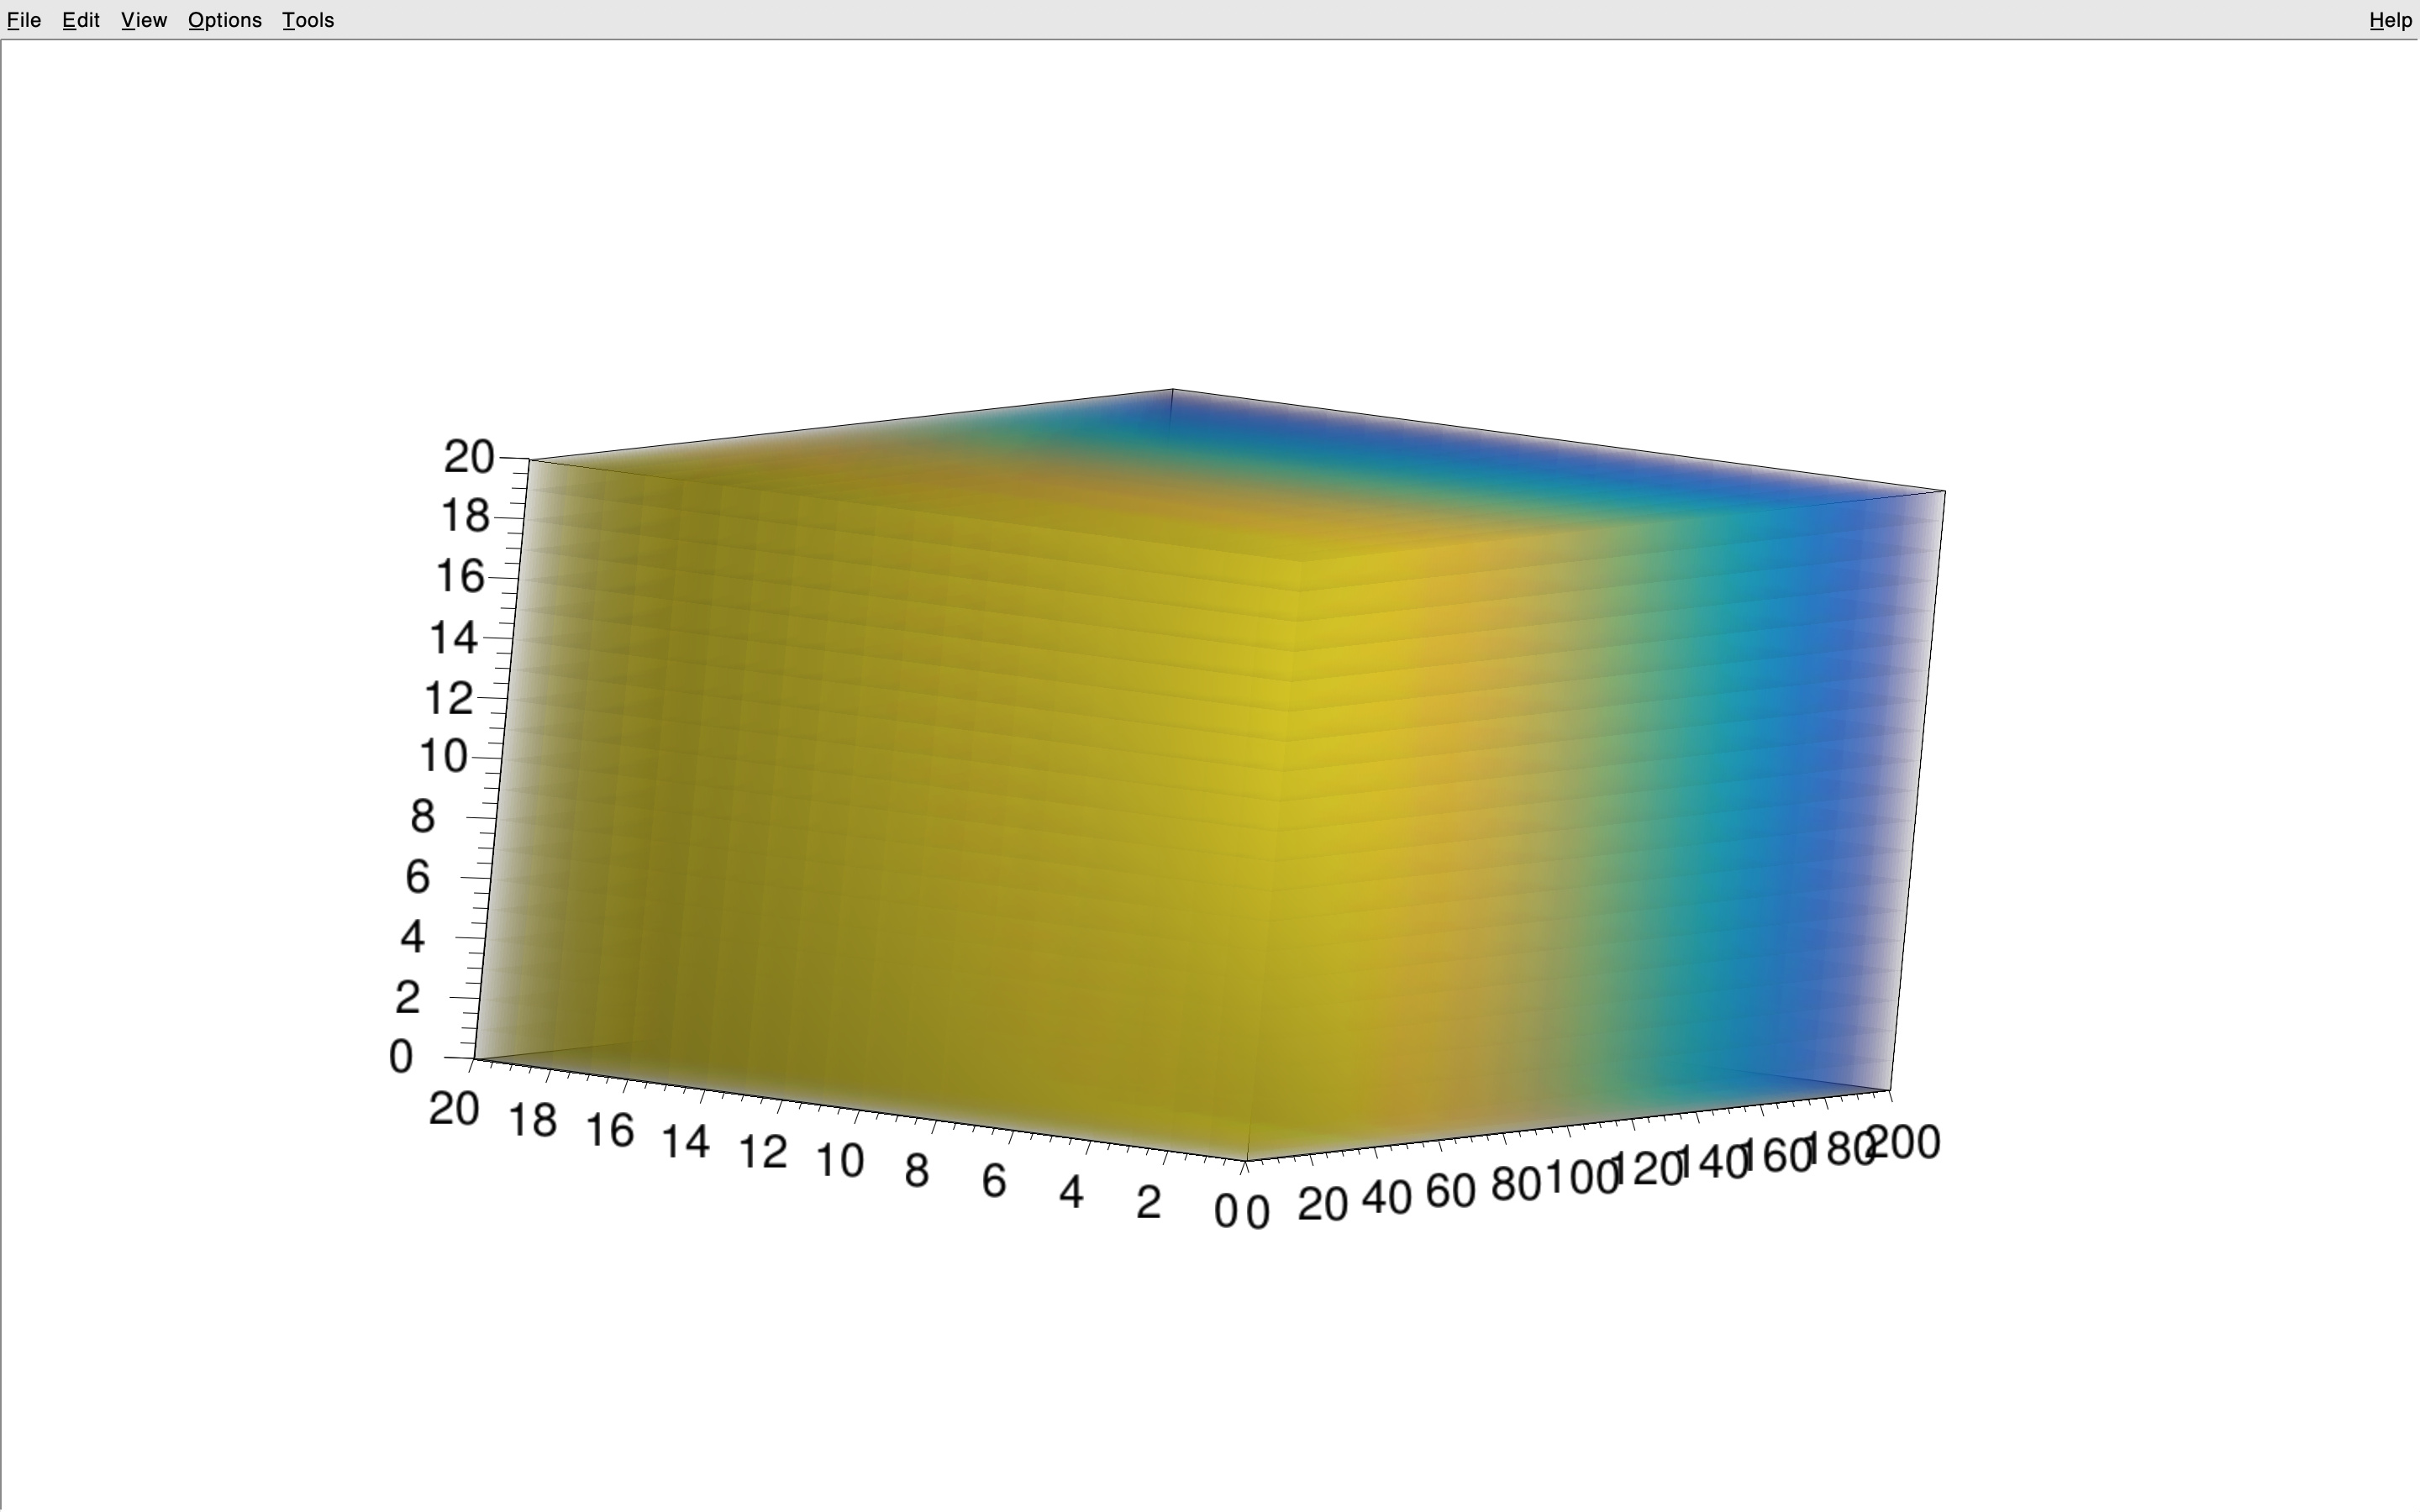
I’m working with 3D histograms. Is it possible to change the physical length of the x-axis?
Right now, no matter the ranges for x,y,z, the axis length is identical.
Thanks!
void sandbox()
{
   //Create and fill TH3.
   const UInt_t nX = 200;
   const Double_t xMin = 0, xMax = 200, xStep = (xMax - xMin) / (nX - 1);
   const UInt_t nY = 20;
   const Double_t yMin = 0, yMax = 20., yStep = (yMax - yMin) / (nY - 1);
   const UInt_t nZ = 20;
   const Double_t zMin = 0., zMax = 20., zStep = (zMax - zMin) / (nZ - 1)
     ;

   TH3F *hist = new TH3F("glvoxel", "glvoxel", 200, 0., 200., 20, 0., 20., 20, 0., 20.);

   //Fill the histogram to create a "sphere".
   for (UInt_t i = 0; i < nZ; ++i) {
      const Double_t z = zMin + i * zStep;
      for (UInt_t j = 0; j < nY; ++j) {
         const Double_t y = yMin + j * yStep;
         for (UInt_t k = 0; k < nX; ++k) {
            const Double_t x = xMin + k * xStep;
            const Double_t val = 1. - (x * x + y * y + z * z);
            hist->SetBinContent(k + 1, j + 1, i + 1, val*100);
         }
      }
   }
   gStyle->SetCanvasPreferGL(1);
   hist->Draw("glcol");
}