3 Variables Visualization

I came across with a problem and I have been looking for options but after a while I haven’t been able to find a straightforward way to do it. I’m sure someone else have faced it before and ROOT may have already implemented the proper methods to do it.

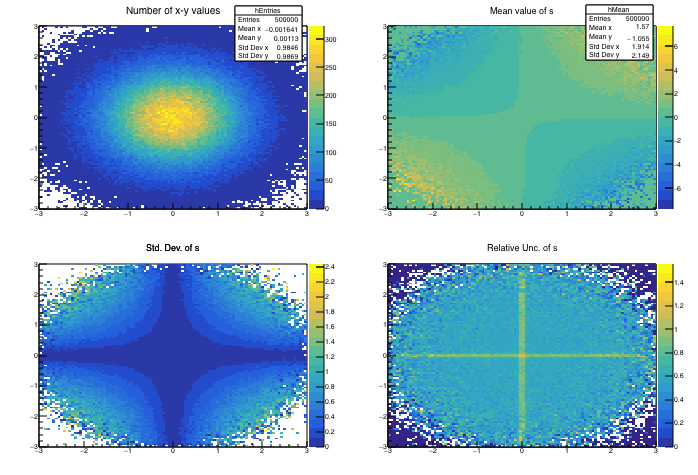
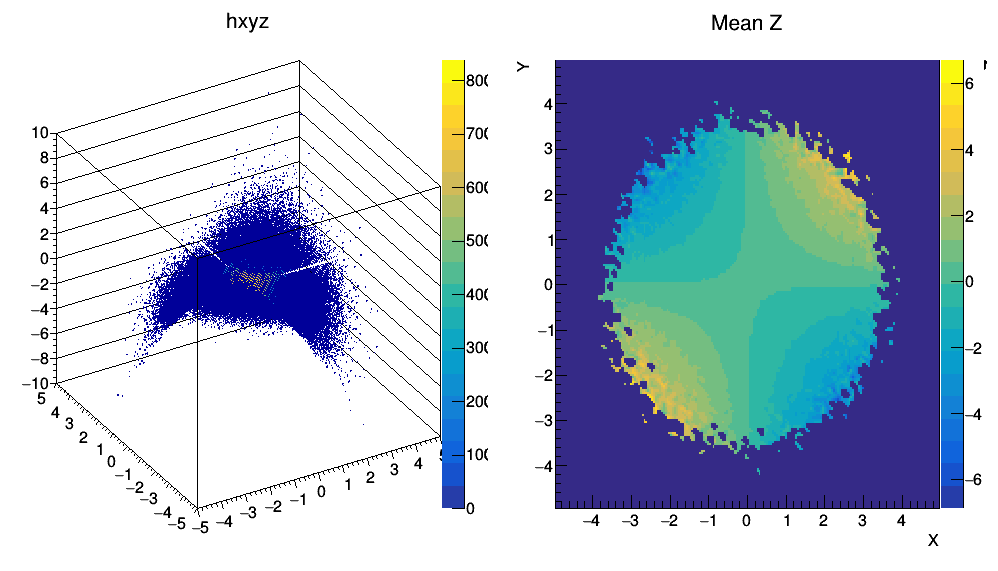
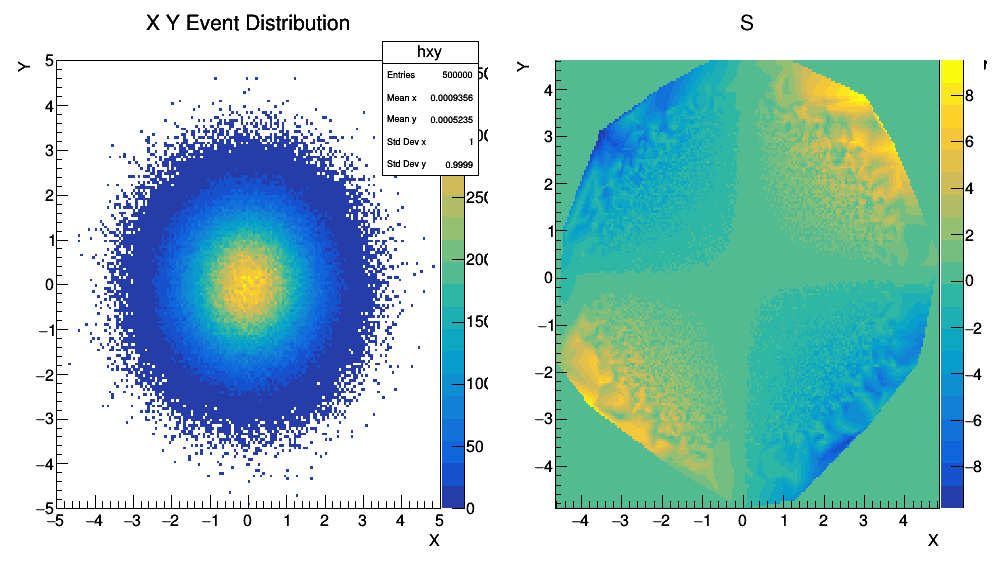
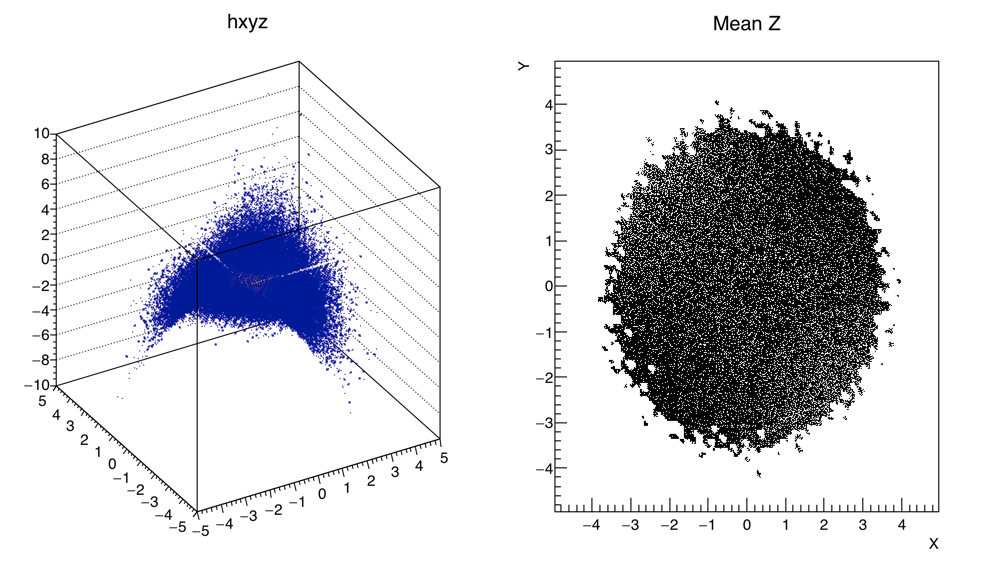
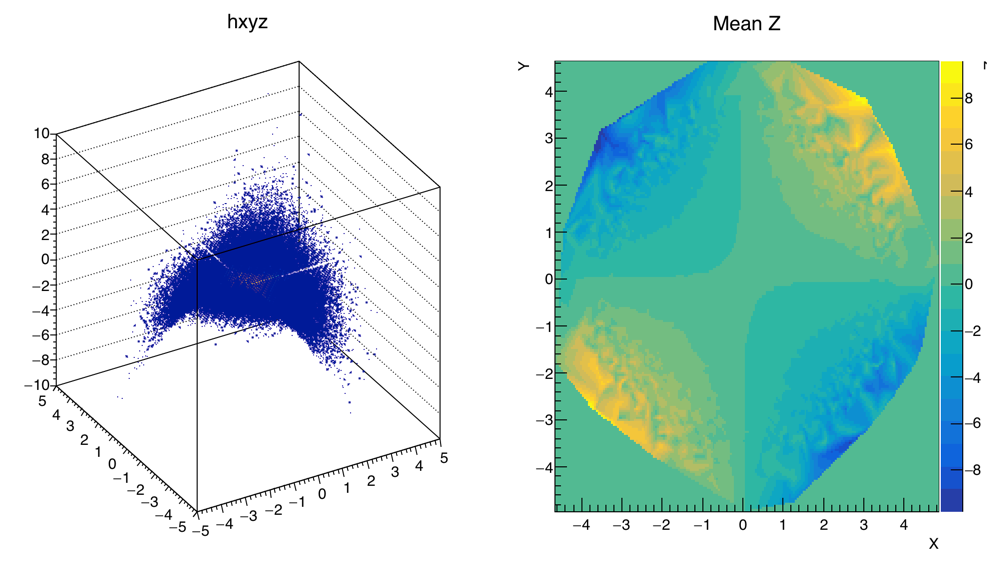
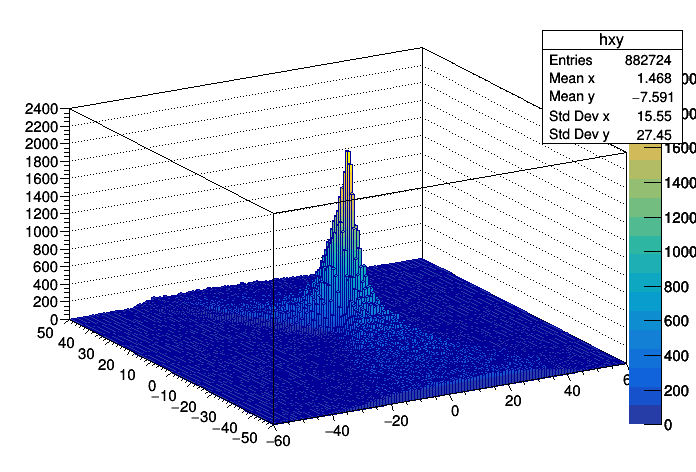
I have a data set composed by three variables. Each event has an associated X, Y position, and S. I need to make a 2D (or 3D) representation in a histogram in which the X and Y axis are bins of the variables X and Y and the average of S for that particular bin is represented using a Rainbow color map in linear scale. It’s like having a TH3D histogram suppressing information about the number of events in each bin, or (even better) to include the number of events in the bin using the Z axis (similar to using the LEGO2Z option but the color scale representing <S>).

I saw this previous post Project TH3 into TH2-COLZ-like plot but I’m not sure on how they use the Draw method there.

Please let me know if you can point any information out to solve this problem. Any help would be appreciated,

FWIW I named this post as close as possible as https://root.cern.ch/3-variables-visualization-techniques it would be useful if we can include some links to examples like https://root.cern.ch/doc/v610/classTHistPainter.html#HP25 there

All the best,
Andres

1 Like

I am not sure what kind of representation you want to achieve. For each X,Y do you have a unique S value ? if yes you can use a TH2 and draw it as lego-plot or surface-plot. If not you will need a TH3 and draw it as 3D box colored box plot (for instance)/

For each X,Y I have one single value of S. However, in each event S vary even if X and Y are closer enough, so what I want to take the average of S over the bin. To get one single value of S for each bin.

What about using TGraph2D instead of TH2 ?

I wanted to use a histogram because I have more than 3M of events (after doing the required cuts) and now I’m using TProof to process a quite big ROOT file, TGraph2D::SetPoint uses n as an argument so I’m not sure how this will work when working with multiple cores trying to fill the Graph. Is there any option to avoid n when setting a point in the graph?

No, but you can do something like:

int n = g->GetN();
g->setPoint(n,x,y,s);

Hi,

I have done this in the past, unfortunately I have no idea where that piece of code has wandered off to. I’ve created a short example that demonstrates my solution. I would double check the math as I did it rather quickly. The example uses s = x * y * unif(0,1). The mean and std. dev. are computed recursively such that a histogram can be used to store the data, with a required additional histogram needed to keep track of the number of entries in each bin.

I had issue with TH2 plotting with the options “E COLZ” (a 2D plot on top of a color hist), so I had to manually create a histogram to represent the std deviations. Maybe @couet can comment on this.

#include "TCanvas.h"
#include "TRandom.h"
#include "TH2D.h"

void TH2_wAvg(){
   //The number of x-y counts (ignores s)
   TH2D *hEntries = new TH2D("hEntries","Number of x-y values", 100,-2,2,100,-2,2);
   //The mean value of s for each x-y bin.
   TH2D *hMean = (TH2D*) hEntries->Clone("hMean");
   hMean->SetTitle("Mean value of s");

   for (int i=0;i<500000;i++) {
      double x = gRandom->Gaus();
      double y = gRandom->Gaus();
      double sVal = gRandom->Uniform() * x * y;

      //Find the correct bin
      int bin = hEntries->FindBin(x, y);

      //First add another count to the entries histogram.
      hEntries->Fill(x,y);
      int numBinEntries = hEntries->GetBinContent(bin);

      //Compute the new mean
      double prevMean = hMean->GetBinContent(bin);
      double newMean = prevMean + (sVal - prevMean) / numBinEntries;

      //Compute the new std deviation (sqrts are expensive so we store the
      //squared std dev while in the loop).
      double prevStdDevSq = hMean->GetBinError(bin);
      double newStdDevSq = (prevStdDevSq + pow(prevMean,2) - pow(newMean,2)
                     + (pow(sVal,2) - prevStdDevSq - pow(prevMean,2)) / numBinEntries);

      hMean->SetBinContent(bin, newMean);
      hMean->SetBinError(bin, newStdDevSq);
   }

   //We now have to take the sqrt of the bin errors to get the correct std deviations.
   for (int i=0;i<hMean->GetNcells();i++) {
      hMean->SetBinError(i, sqrt(hMean->GetBinError(i)));
   }

   TCanvas *c = new TCanvas("canvas");
   c->DivideSquare(4);
   c->cd(1);
   hEntries->Draw("COLZ");
   c->cd(2);
   hMean->Draw("COLZ");
   c->cd(3);
   //Make a histogram with the stddevs. (I thought "E" would have made this,
   //but not plotting well)
   TH2D *hStdDev = (TH2D*) hMean->Clone("hStdDev");
   hStdDev->SetTitle("Std. Dev. of s");
   for (int i=0;i<hMean->GetNcells();i++) {
      hStdDev->SetBinContent(i, hMean->GetBinError(i));
      hStdDev->SetBinError(i,0);
   }
   hStdDev->Draw("COLZ");
   c->cd(4);
   //Make a histogram with relative unceratinties.
   TH2D *hRelUnc = (TH2D*) hMean->Clone("hRelUnc");
   hRelUnc->SetTitle("Relative Unc. of s");
   for (int i=0;i<hMean->GetNcells();i++) {
      hRelUnc->SetBinContent(i, fabs(hMean->GetBinError(i)/hMean->GetBinContent(i)));
      hRelUnc->SetBinError(i,0);
   }
   hRelUnc->Draw("COLZ");

}
1 Like

This will most likely lead to race conditions if used with multiple cores.

@ganis Could you comment on this please?

Hello,
I would solve his problems as @ksmith ksmith proposes, using TH1::Sumw2 to automatize the error calculation and TH1::Divide to get to the mean. This would be the modified example:

#include "TCanvas.h"
#include "TRandom.h"
#include "TH2D.h"

void h2avg()
{

  //The number of x-y counts (ignores s)
   TH2D *hEntries = new TH2D("hEntries","Number of x-y values", 100,-2,2,100,-2,2);
   hEntries->Sumw2();
   //The mean value of s for each x-y bin.
   TH2D *hMean = (TH2D*) hEntries->Clone("hMean");
   hMean->Sumw2();
   hMean->SetTitle("Mean value of s");

   for (int i=0;i<500000;i++) {
      double x = gRandom->Gaus();
      double y = gRandom->Gaus();
      double sVal = gRandom->Uniform() * x * y;

      hEntries->Fill(x,y);
      hMean->Fill(x,y,sVal);
   }

   // Divide
   hMean->Divide(hEntries);

   TCanvas *c = new TCanvas("canvas");
   c->Divide(1,2);
   c->cd(1);
   hEntries->DrawClone("COLZ");
   c->cd(2);
   hMean->DrawClone("COLZ");

   delete hEntries;
   delete hMean;
}

Working with these two histograms there will be no problem of race conditions in PROOF, as the workers are separated processes and histogram merging treats correctly the errors (if TH1::Sumw2 is called).

G Ganis

Interesting, I wasn’t aware that the error would be treated correctly in that case.

Thank you guys. I was using TH3D, BinCenter and BinContent and making a weighted average:

   TGraph2D *gxyz = new TGraph2D();
   gxyz->SetTitle("Mean Z;X;Y;Z");
   TH3D *hxyz = new TH3D("hxyz","hxyz",100,-5.,5.,100,-5,5,100,-10,10);
 
   for (int i=0;i<500000;i++) {
     double x = gRandom->Gaus();
     double y = gRandom->Gaus();
     double z = gRandom->Uniform() * x * y;
     
     hxyz->Fill(x,y,z);
     
   }
			 
   Int_t nx = hxyz->GetNbinsX();
   Int_t ny = hxyz->GetNbinsY();
   Int_t nz = hxyz->GetNbinsZ();
   
   Int_t nn = 0;
   Double_t x, y, z, nw, nevts;
   Double_t avgz = 0.0;
   
   for (Int_t i = 1; i <= nx; i++) {
     x = hxyz->GetXaxis()->GetBinCenter(i);
     for (Int_t j = 1; j <= ny; j++) {
       y = hxyz->GetYaxis()->GetBinCenter(j);  
       for (Int_t k = 1; k <= nz; k++) {
	 z = hxyz->GetZaxis()->GetBinCenter(k);
	 nw = hxyz->GetBinContent(i,j,k);
	 avgz += (z*nw);
	 nevts += nw;
       }
       avgz = avgz/nevts;
       gxyz->SetPoint(nn,x,y,avgz);
       nevts = 0;
       avgz = 0.0;
       nn++;      
     }
     
   }
			 
   TCanvas *c = new TCanvas("c","c",1000,600);
   c->Divide(2,1);
   c->cd(1);
   hxyz->Draw("BOX2Z");
   c->cd(2);
   gxyz->SetNpx(200);
   gxyz->SetNpy(200);
   gxyz->Draw("COLZ 0");

Which produces:

If we use TGraph2D:

   TGraph2D *gMean = new TGraph2D();
   gMean->SetTitle("S;X;Y;Z");
   TH2D *hxy = new TH2D("hxy","X Y Event Distribution;X;Y",160,-5,5,160,-5,5);

   for (int i=0;i<500000;i++) {
     double x = gRandom->Gaus();
     double y = gRandom->Gaus();
     double sVal = gRandom->Uniform() * x * y;
     
     int n = gMean->GetN();
     gMean->SetPoint(n,x,y,sVal);
     hxy->Fill(x,y);
   }
   
   TCanvas *c = new TCanvas("c","c",1000,600);
   c->Divide(2,1);
   c->cd(1);
   hxy->Draw("COLZ");
   gMean->SetNpx(200);
   gMean->SetNpy(200);
   c->cd(2);
   gMean->Draw("COLZ");

Which is in my understanding the most precise description but not ideal if you have a lot of data.

And from @ganis:

Can you tell what’s wrong with the first method?

[EDIT] Semicolon added

What do you mean wrong? It looks very similar to method 3 that you posted.

Hi @ksmith. I’m referring to the one I wrote with TH3D, “sorrouding” areas have a mean S value of ~ -6, while for the second and the third method the value is 0.

The TGraph2D has no values set there and is displaying a color that is “below” the color bar. If you plot without COLZ you will see that is the case.

More specifically, it is because those areas have content equal to zero which you are then dividing by nevts to get nan. Here is a revised version of the loops:

   for (Int_t j = 1; j <= nx; j++) { 
      x = hxyz->GetXaxis()->GetBinCenter(j);   
      for (Int_t i = 1; i <= ny; i++) {
         y = hxyz->GetYaxis()->GetBinCenter(i);
         double nevts = 0;
         double avgz = 0.0;
         for (Int_t k = 1; k <= nz; k++) {
            z = hxyz->GetZaxis()->GetBinCenter(k);
            nw = hxyz->GetBinContent(i,j,k);
            avgz += (z*nw);
            nevts += nw;
         }
         if (avgz != 0) {
            gxyz->SetPoint(nn++,x,y,avgz/nevts);
         }
      } 
   }        

(Also, your example was missing a semicolon.)

1 Like

Hi,

More specifically, it is better to check if you have events in the bin, i.e. to fill the graph only if nevts > 0 (the average can be zero …).
Also, you seem to be doing a weighted average, which I am not sure is what you want, but which explains the remaining difference with what I proposed.

G Ganis

This topic was automatically closed 14 days after the last reply. New replies are no longer allowed.