Hi everyone
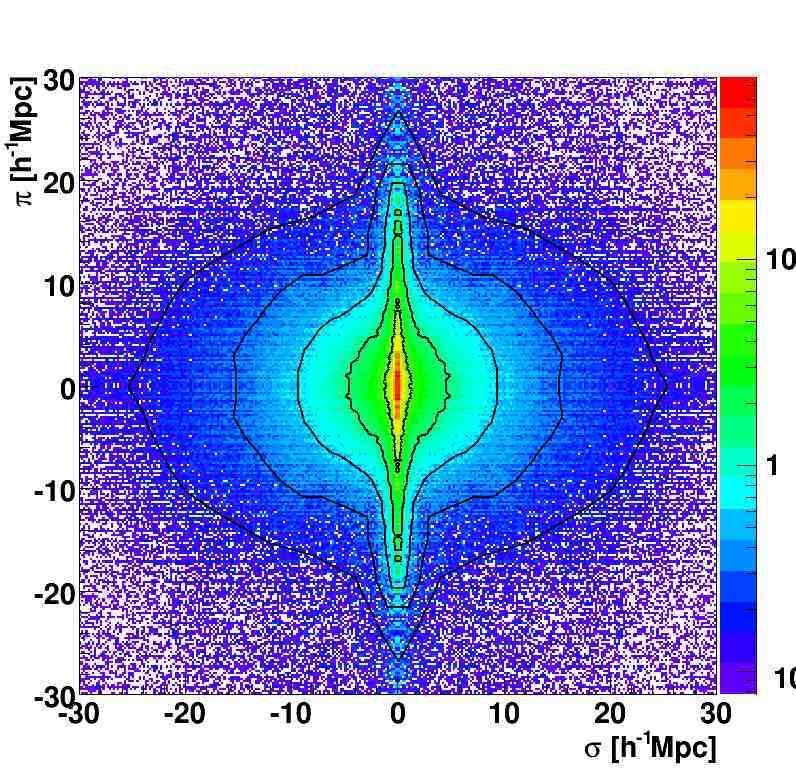
I am trying to do a 2D histogram with some contour lines. The contours look very strange probably because the histogram is a bit noisy. I think I need more smooth contours… I attached the the program I am using. The program produces 2 histogram because this was the only way I found to plot contours and colours. But the contours look ugly… does anybody know how to do this properly?
thanks
florian
#include <math.h>

double kbinwd = 0.2;
double cormax = 30.;
const int kbins = cormax/kbinwd;

void kaiser(){
   gROOT->SetStyle("Plain");
   gStyle->SetOptStat(0);
   gStyle->SetOptFit(1111);
   gStyle->SetPalette(1);

   double cpibin, csigmabin;
   double value;
   cout<<"kbins = "<<kbins<< endl;

   TCanvas *wake = new TCanvas("c","kaiser plot",0,0,800,800);
   wake->SetLogz();
   TH2F *h = new TH2F("h","kaiser",2*kbins,-cormax,cormax,2*kbins,-cormax,cormax);
   TH2F *h2 = new TH2F("h","kaiser",2*kbins,-cormax,cormax,2*kbins,-cormax,cormax);

   int n = 0;
   ifstream widthfile("kaiser.txt");
   while((widthfile >> cpibin >> csigmabin >> value)){
      //cout<<"cpibin = "<<cpibin<<" csigmabin = "<<csigmabin<<" value = "<<value<<flush<< endl;
      h->Fill(csigmabin+kbinwd/2,cpibin+kbinwd/2,value);
      h2->Fill(csigmabin+kbinwd/2,cpibin+kbinwd/2,value);
      // mirror the kaiser plot on all axis

      h->Fill(csigmabin+kbinwd/2,-cpibin-kbinwd/2,value);
      h->Fill(-csigmabin-kbinwd/2,cpibin+kbinwd/2,value);
      h->Fill(-csigmabin-kbinwd/2,-cpibin-kbinwd/2,value);
      h2->Fill(csigmabin+kbinwd/2,-cpibin-kbinwd/2,value);
      h2->Fill(-csigmabin-kbinwd/2,cpibin+kbinwd/2,value);
      h2->Fill(-csigmabin-kbinwd/2,-cpibin-kbinwd/2,value);

      n++;
   }
   widthfile.close();

   h->SetTitle("");
   h->GetYaxis()->SetTitle("#pi [h^{-1}Mpc]");
   h->GetXaxis()->SetTitle("#sigma [h^{-1}Mpc]");
   h->GetYaxis()->SetTitleOffset(1.2);

   h2->SetContour(2);
   h2->SetContourLevel(0,10);
   h2->SetContourLevel(1,0.01);
   //h->SetContourLevel(2,1);
   //h->SetContourLevel(3,1);

   //h->SetMaximum(30);
   h->Draw("COLZ");
   h2->Draw("CONT3 same");
   //h->Draw("COLZ");
}
kaiser.txt (396 KB)

c.pdf (316 KB)