2D histogram from text file

Hi,
I have a text file with two column data.
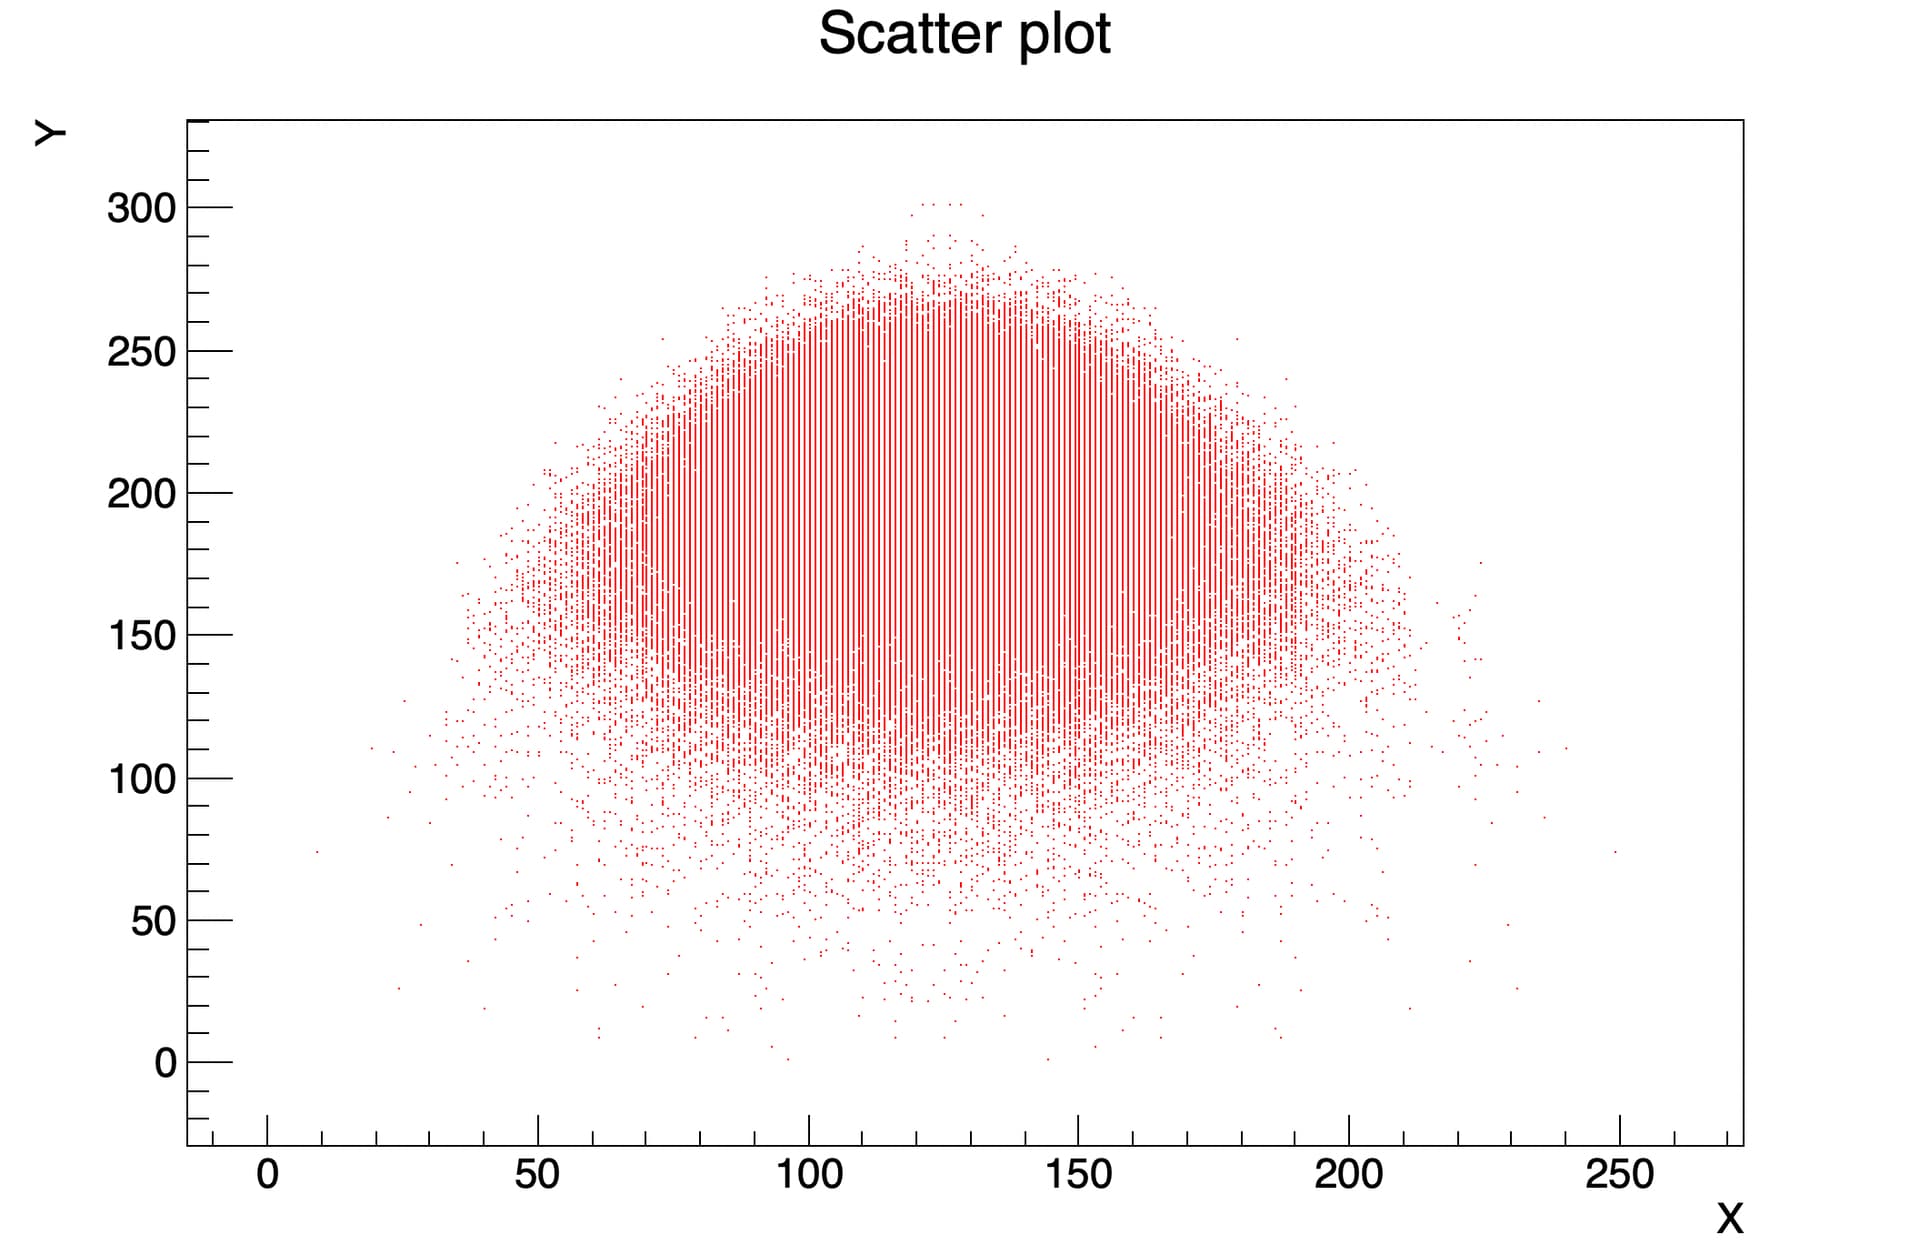
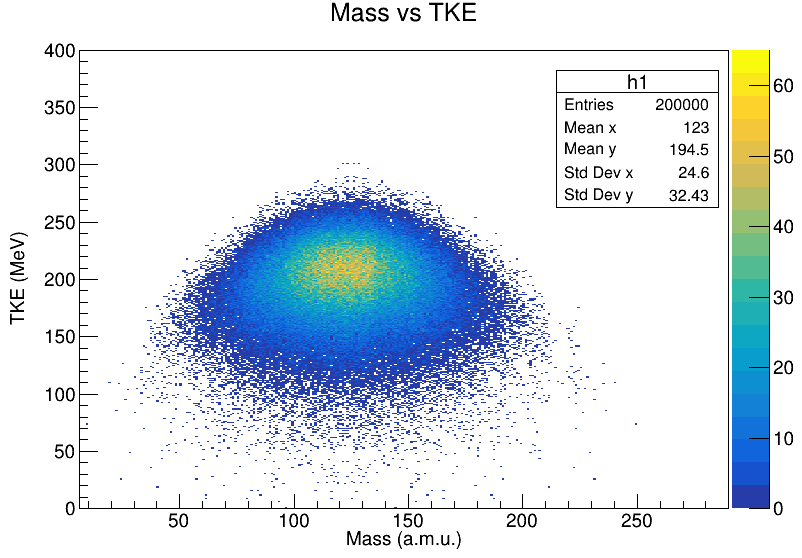
I need to plot a 2D scatter histogram from it.
I am using the program below but it is reading only the first row of the file. I am unable to locate the problem. I am also attaching the txt file for your convenience.
MassTKE.txt (2.2 MB)

{
  auto *h1 = new TH2D("h1", "Mass vs TKE", 400, 0, 400, 400, 0, 400);
  auto *file = new TFile("Histogram.root", "recreate");
  h1->GetXaxis()->SetTitle("Mass (a.m.u.)");h1->GetXaxis()->CenterTitle();
  h1->GetYaxis()->SetTitle("TKE (MeV)");h1->GetYaxis()->CenterTitle();

  ifstream in("MassTKE.txt");
  std::vector<std::pair<int, int>> vec;

  int N, Z;
  while (in >> N && in >> Z) 
  { cout<<N<<"   "<<Z<<endl;
    h1->Fill(N, Z);}

file->cd();
h1->Write();
file->Close();
}

_ROOT Version: 6.14/04
_Platform:Ubuntu 18.04 LTS
_Compiler:linuxx8664gcc


Your example is building a 1D histogram, not a 2D one.
As you want a scatter plot you might consider using TScatter.

void MassTKE()
{
   auto canvas = new TCanvas();
   FILE *f = fopen("MassTKE.txt", "r");

   const int n = 200000;
   double x[n];
   double y[n];
   double a,b;

   for (int i=0; i<n; i++) {
      fscanf(f, "%lg %lg", &a,&b);
      x[i] = a;
      y[i] = b;
   }

    auto scatter = new TScatter(n, x, y);
    scatter->SetMarkerColor(kRed);
    scatter->SetTitle("Scatter plot;X;Y");
    scatter->Draw("A");
}

The above code is giving an error:

…/MassTKE.C:17:24: error: unknown type name ‘TScatter’
auto scatter = new TScatter(n, x, y);

This is a new class you need the newest ROOT version.

Thank You for guiding. After changing the read method, I get a 2D histogram.
The modified program is:

{
  auto *h1 = new TH2D("h1", "Mass vs TKE", 400, 0, 400, 400, 0, 400);
  auto *file = new TFile("Histogram.root", "recreate");
  h1->GetXaxis()->SetTitle("Mass (a.m.u.)");h1->GetXaxis()->CenterTitle();
  h1->GetYaxis()->SetTitle("TKE (MeV)");h1->GetYaxis()->CenterTitle();

   FILE *f = fopen("MassTKE.txt", "r");

   const int n = 200000;
   double x[n];
   double y[n];
   double a,b;

   for (int i=0; i<n; i++) {
      fscanf(f, "%lg %lg", &a,&b);
      x[i] = a;
      y[i] = b;
     h1->Fill(a, b);
   }

file->cd();
h1->Write();
file->Close();
}

1 Like

Good, that’s not a scatter plot, it is a heatmap. But fine if it’s ok for you.

This topic was automatically closed 14 days after the last reply. New replies are no longer allowed.