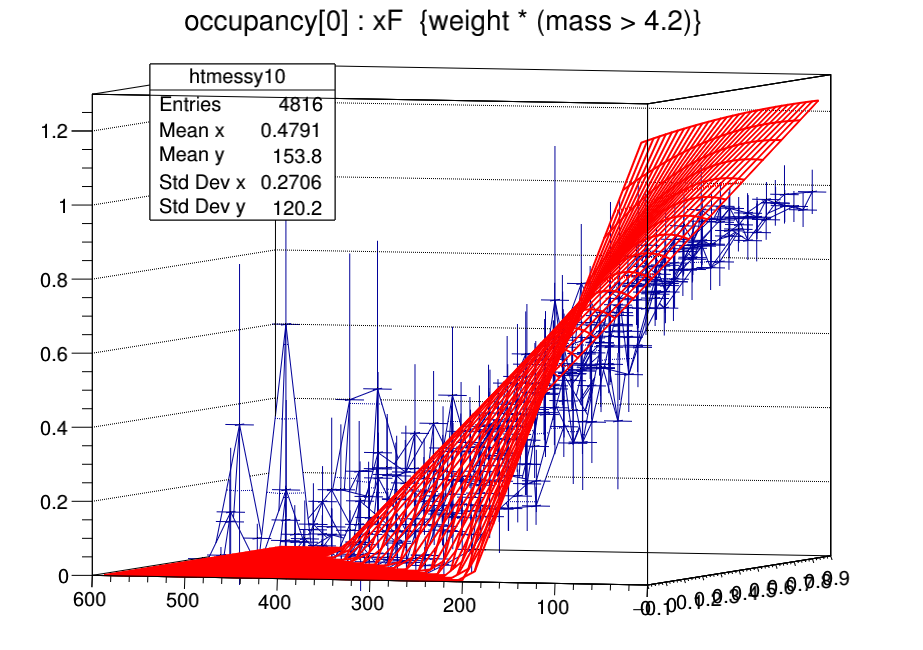
I have a 2D histogram that I’m trying to fit, and it seems to work fine except that when I draw the histogram with the attached fit function (via e.g. hist2d->Draw("surf0 E") here), it seems to draw the function to a different scale than the histogram. This is supposed to be a function like 1 + y*([0] + [1]*x + ...) times a step function for z>0 so the y=0 edge should be exactly 1, and it is when I use Eval function, but instead it appears scaled up above 1.2 due to the histogram’s error bars going above 1.2.
For some reason I cannot reproduce the original plot with error bars and the fit function; but the bad behavior is still seen with draw option “surf0 E”, except it doesn’t draw error bars (which also seems like a bug).
I have also found that once I have fit a 2D function to a 2D histogram and draw with error bars option “E” (only), I am unable to use the mouse to rotate the view. It can still rotate when drawn with option “surf0” but not with option “E”. Before fitting the function, it works fine with option “E”. This also seems like a bug?
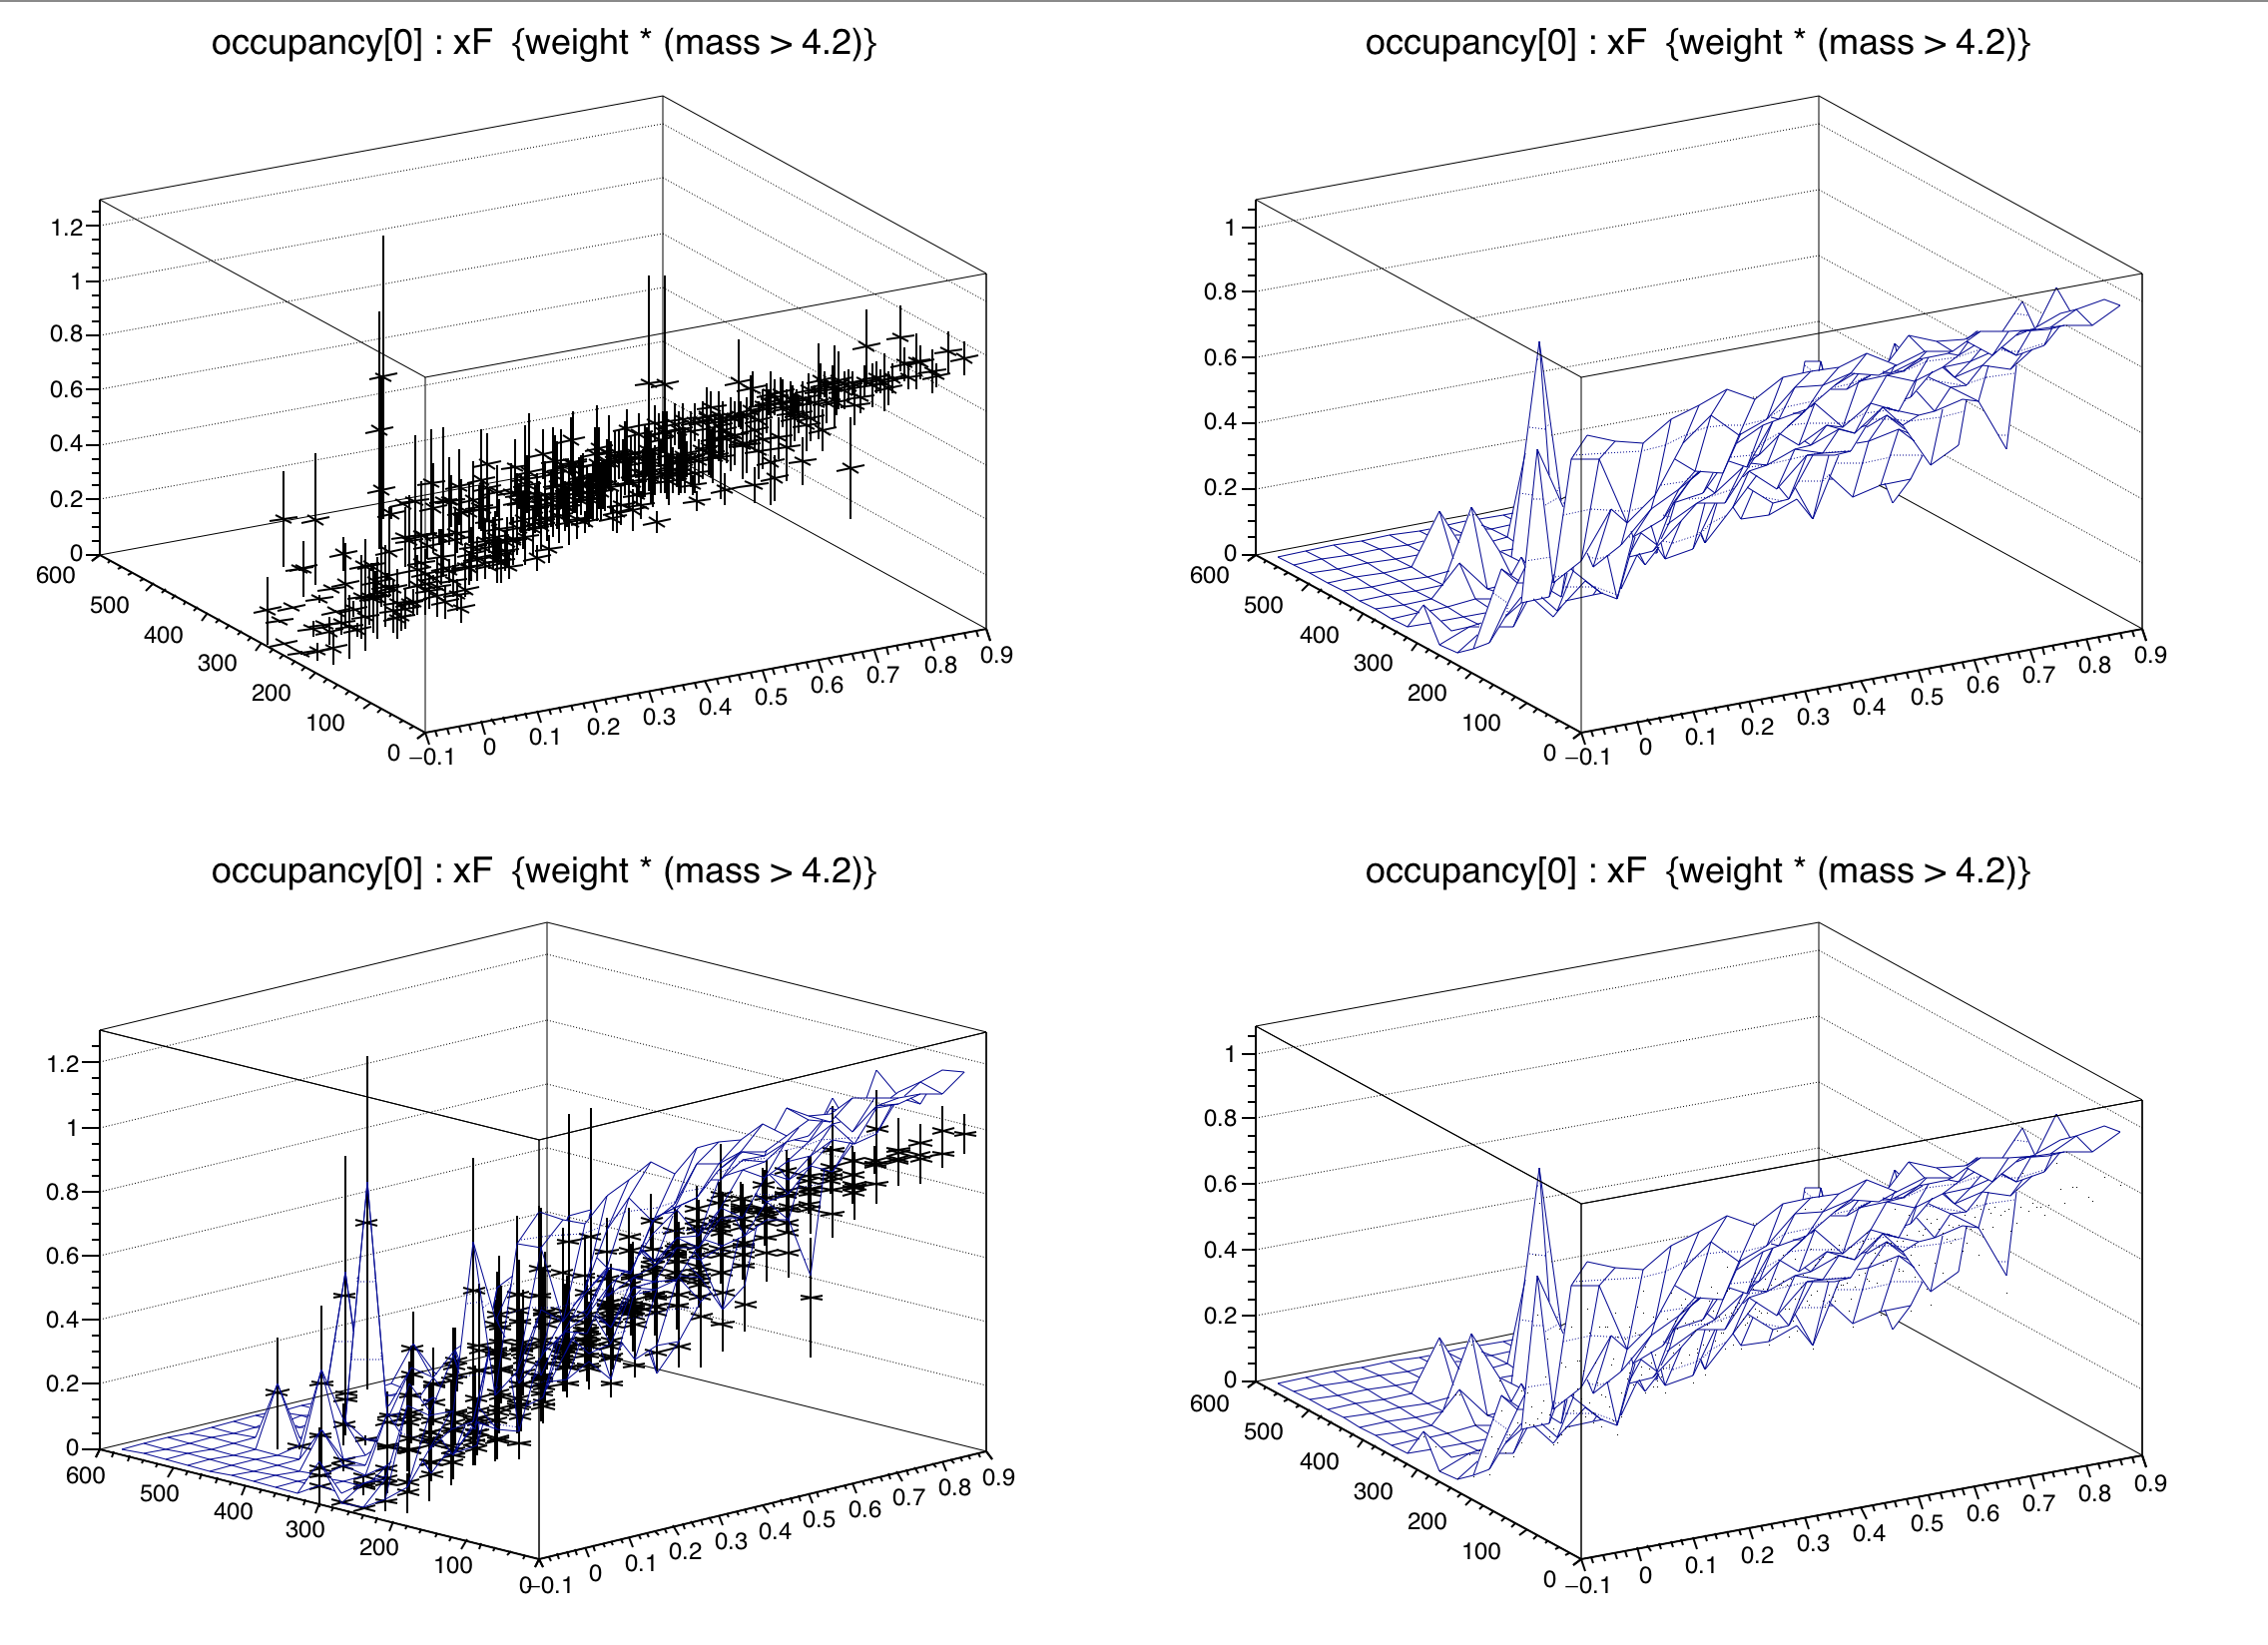
If I use “SURF E” I get the surface and not the errors. Even If I do not fit.
So the SURF option is taken and E is ignored. But your original plot shows that SURF and E
can be combined . It might be it was possible with older ROOT version. Which version are you using ?
I am on 6.10.06 now, but was on 6.10.04 before. I don’t think it was the version, I think I must have done something strange to make that work before, or maybe I drew it with the “same” option.
Does “E” also draw the fit now? I mainly just want a simple way to draw the fit and error bars at the same time (and be able to rotate the view).
There is a report that scales used by “E” and “SURF0” are inconsistent (when drawn together).
Indeed, it seems to me that this small macro reproduces this problem (with ROOT 6.12/06 and 6.13/02):