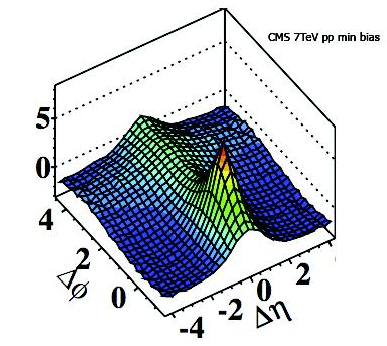
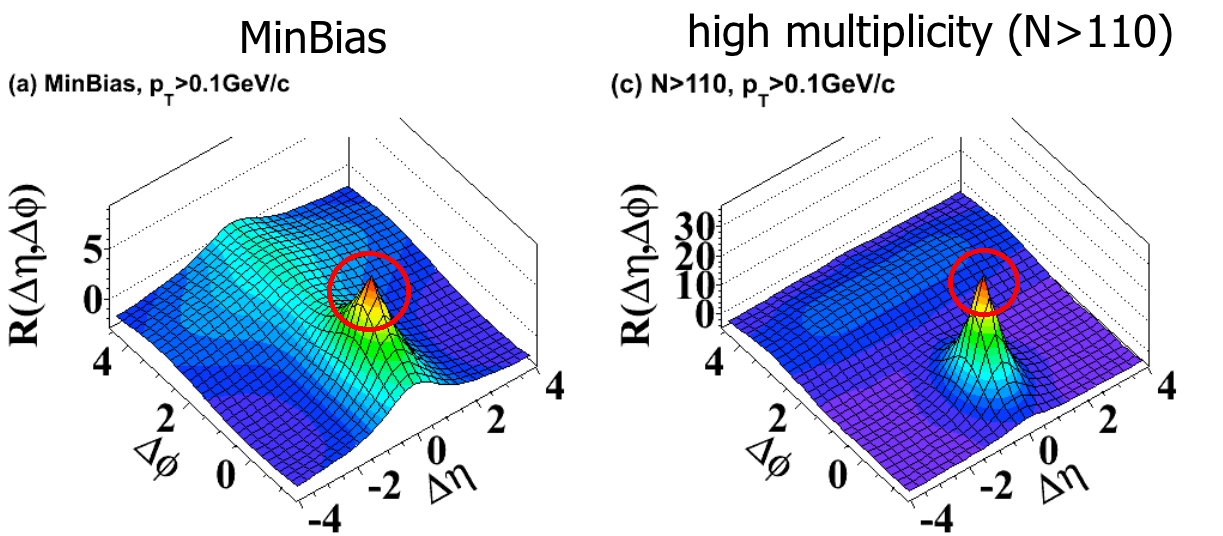
No no, they are different of course, but it’s just an example. For the (0,0) peak they, in CMS, have very sharp peak, for me this peak has a size of a bin - it’s flat on top (rectangle of a bin size in x and y). Maybe another example from the CMS paper is better (hope it’s more clear to see what I mean):
The root algorithm drawing surfaces simply connect the bin centers.
If you have a such “flat peak” it is because of your data.
Check with other options like LEGO or COL.
Very likely they will confirm you have there a kind of platform made of several bins.
OK! Thanks, it helped! I didn’t know that it connects the centers of bins. I have even number of bins in the specified range where 0 is in the middle, so i.e. 4 bins make the flat peak. Specifying odd number should solve the problem.