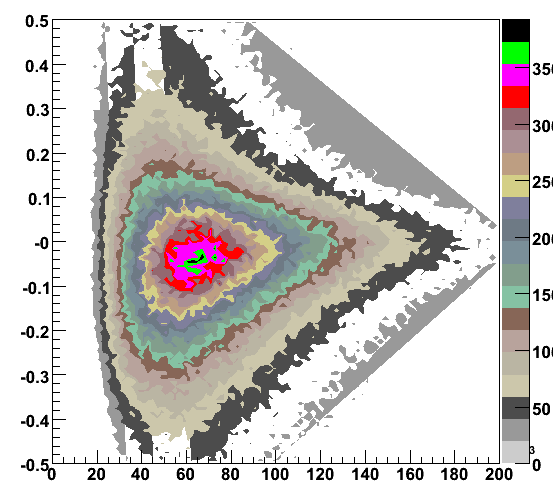
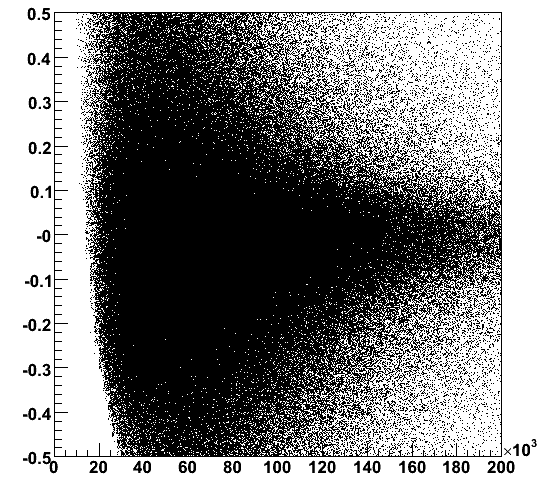
I am seeing somewhat confusing result from 2D histogram. In cont draw mode, I see a very clear line drawn by grey but if I plot in scatter mode, I do not see such distribution. Also, there seems to be a gap between dark gray area and light gray area which cannot be seen in scatter mode. Could you please take a look at the plots attached?
Try other contour’s options (cont1, cont2, etc …) see: root.cern.ch/root/html/THistPain … nter:Paint
Sometimes the default option produces the kind of effect you observe. With other options it should be ok. Just try.
Also the option COL might be a good choice in your case.