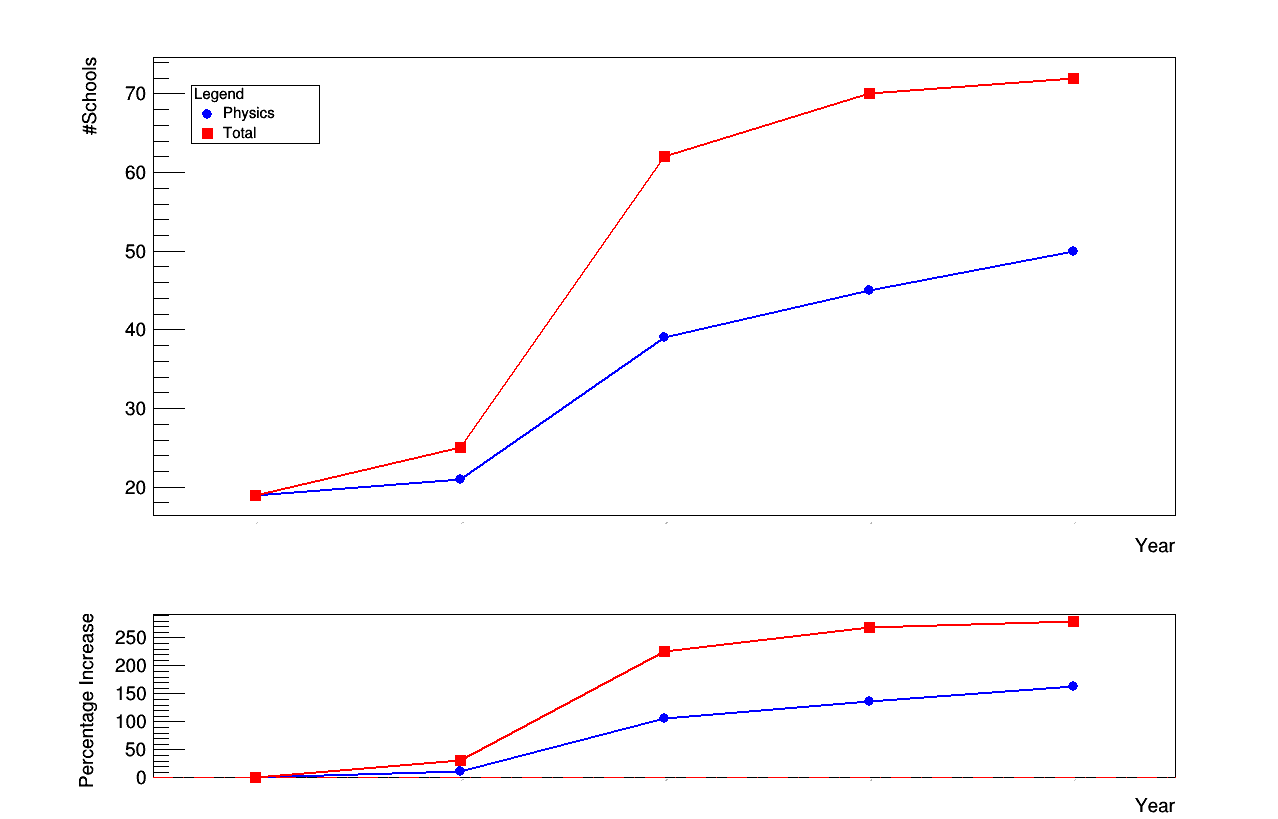
Your macro is a bit messy… It has a lot of useless code, many things are conflicting … It looks a bit like “random coding”… Therefore the list of problems is too log to be detailed here. I just rewrote/cleaned it for the top plot. You can take it as example for the 2nd one. Here it is:
void mulgr() {
   const char *datain = "data.txt";
   TCanvas *c01 = new TCanvas("c01","multigraph",1280,1024);

   TPad *pad1 = new TPad("pad1", "pad1", 0.0, 0.3, 1.0, 1.0);
   pad1->SetGridx();         // Vertical grid
   pad1->Draw();             // Draw the upper pad: pad1
   pad1->cd();

   gStyle->SetTitleFontSize(0.08);
   TMultiGraph *mg = new TMultiGraph("mg","");

   float offx  = 1.3;
   float offy  = 1.3;
   float margr = 0.08;
   float w     = 3;
   float margl = 0.12;
   float line  = 2;
   float xl1   = 0.5, xl2 = 5.5;

   gPad->SetLeftMargin(margl);
   gPad->SetRightMargin(margr);

   TGraphErrors *gr1 = new TGraphErrors(datain,"%lg %lg %*lg %*lg %*lg");
   gr1->SetMarkerColor(kBlue);
   gr1->SetLineColor(kBlue);
   gr1->SetMarkerStyle(20);
   gr1->SetMarkerSize(1.3);
   gr1->SetLineWidth(line);
   mg->Add(gr1);

   TGraphErrors *gr2 = new TGraphErrors(datain,"%lg %*lg %lg %*lg %*lg");
   gr2->SetMarkerColor(kRed);
   gr2->SetLineColor(kRed);
   gr2->SetMarkerStyle(21);
   gr2->SetMarkerSize(1.3);
   gr2->SetLineWidth(line);
   mg->Add(gr2);
   mg->Draw("ALP");

   mg->GetXaxis()->SetTitle("Year");
   mg->GetXaxis()->SetTitleOffset(offx);

   mg->GetYaxis()->SetTitle("#Schools");
   mg->GetYaxis()->SetTitleOffset(offy);

   mg->GetXaxis()->SetTitleFont(43);
   mg->GetXaxis()->SetTitleSize(20);
   mg->GetYaxis()->SetTitleFont(43);
   mg->GetYaxis()->SetTitleSize(20);
   mg->GetXaxis()->SetNdivisions(5);

   mg->GetXaxis()->ChangeLabel(1, 45, 0.02, 31, -1, -1,"2016/17");
   mg->GetXaxis()->ChangeLabel(2, 45, 0.02, 31, -1, -1,"2017/18");
   mg->GetXaxis()->ChangeLabel(3, 45, 0.02, 31, -1, -1,"2018/19");
   mg->GetXaxis()->ChangeLabel(4, 45, 0.02, 31, -1, -1,"2019/20");
   mg->GetXaxis()->ChangeLabel(5, 45, 0.02, 31, -1, -1,"2020/21");

   TLegend* leg = new TLegend(0.15, 0.75, .25, .85);
   leg->SetHeader("Legend");
   leg->AddEntry(gr1, "Physics", "AP");
   leg->AddEntry(gr2, "Total", "P");
   leg->Draw();
}
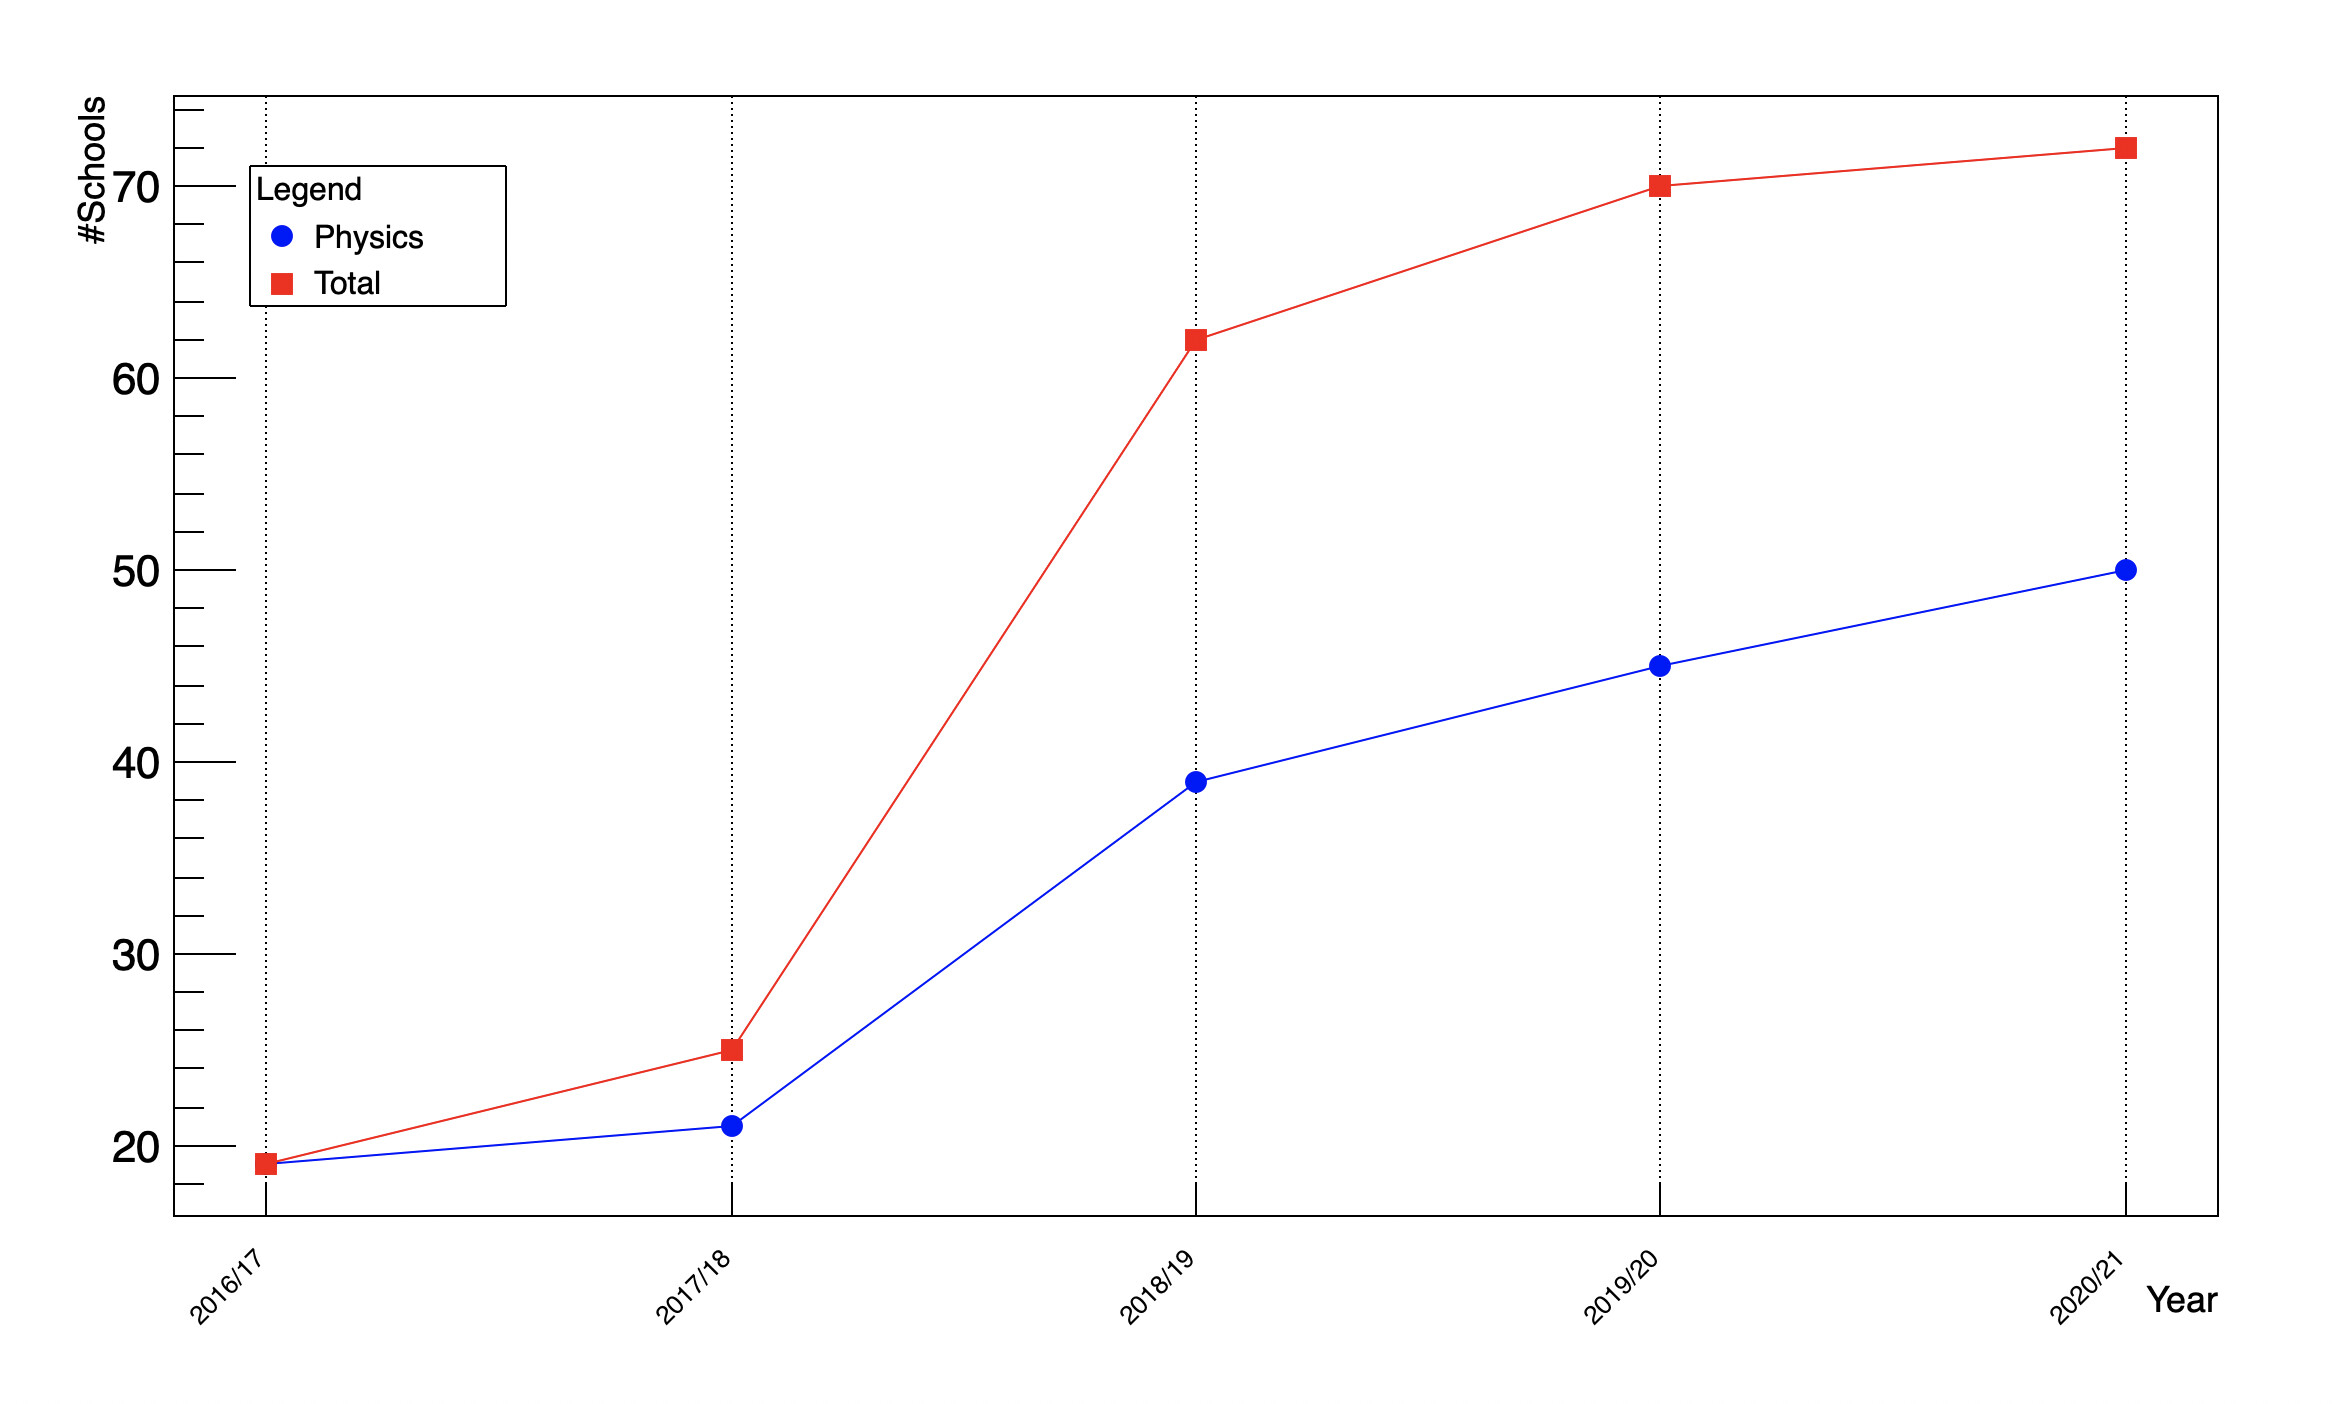
It gives: