Hi,
I want to switch the x and y axis of a 1D histogram, could you help me? Actually I want to turn my histogram.
Thanks
Thanks for your answer.
When I write h->Draw(’‘BAR") or h->Draw(’'HBAR") just the histogram is turned and nothing shows for both options.
What do you mean ? I do not understand your question in that case. I thought the option “HBAR” was what you were looking for. Can you post a small macro showing your problem ?
ok,
  TH1D *his = new TH1D("his","",50,-35,35);
  TH1D *hnew = new TH1D("hnew","",50,-35,35);
   for (Long64_t jentry=0; jentry<100;jentry++) {
his->Fill(x);
}
TCanvas *c1 = new TCanvas("c1", "c1",4,4,1200,500);
TPad *c1_1 = new TPad("c1_1", "c1_1",0.,0.,0.35,1);
TPad *c1_2 = new TPad("c1_2", "c1_2",0.35,0,0.65,1);
   c1_1->Draw();
   c1_1->cd();

   his->Draw("BAR");
   c1->cd();

   c1_2->Draw();
   c1_2->cd();
   hnew->Draw("HBAR");
For two histograms, I have just the axes and nothing shows. When I remove BAR and HBAR options I can see the data.
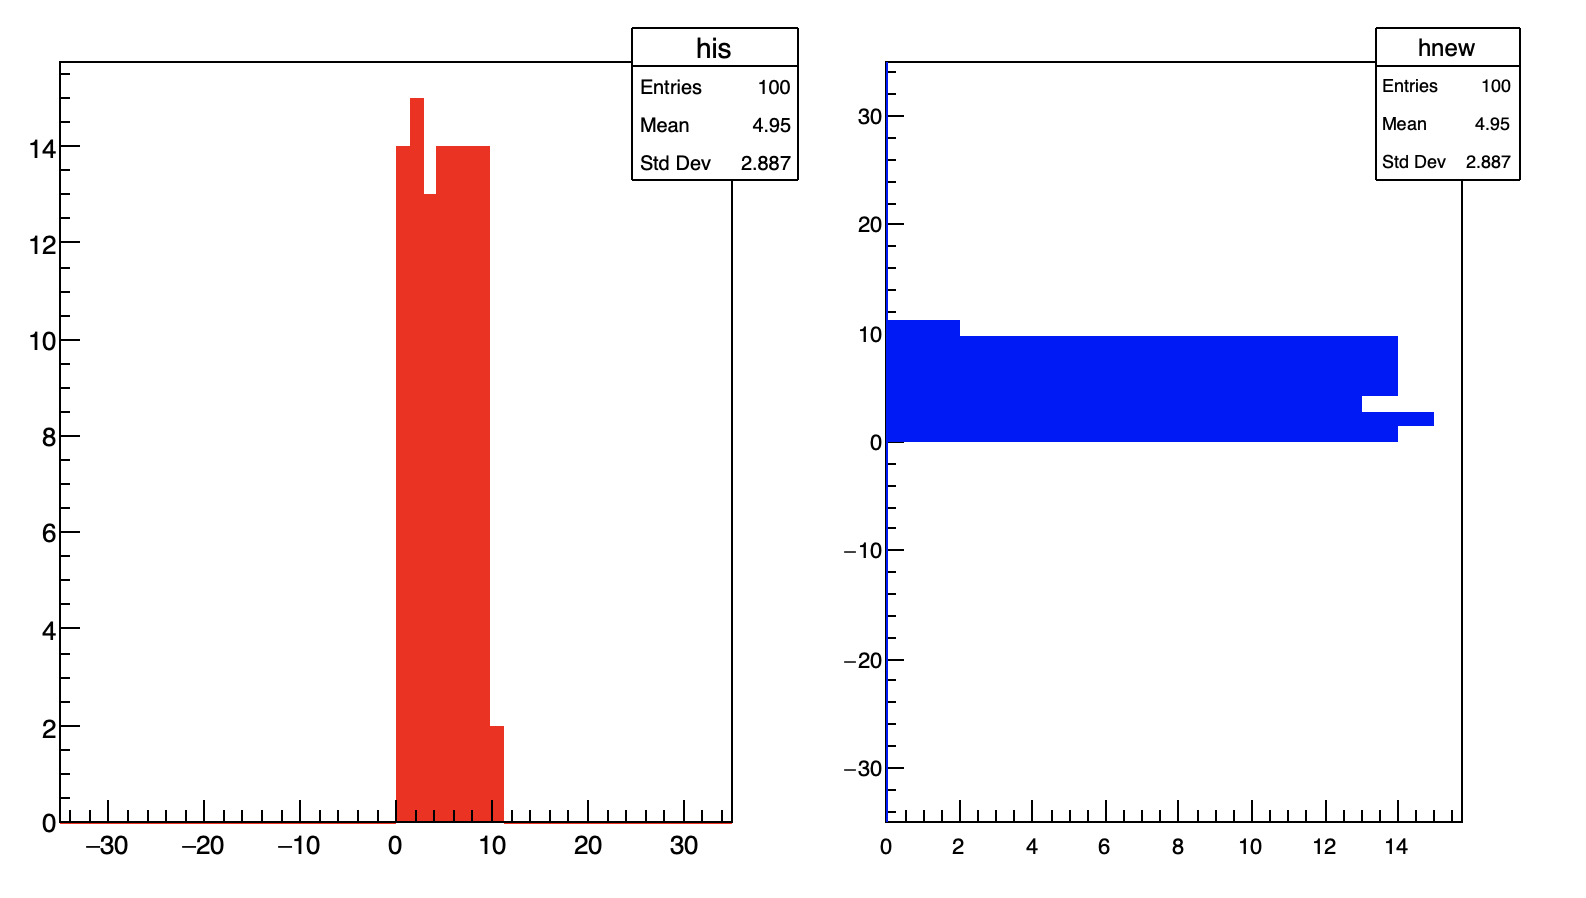
void hajar2() {
   TH1D *his  = new TH1D("his","",50,-35,35);
   TH1D *hnew = new TH1D("hnew","",50,-35,35);
   for (Long64_t jentry=0; jentry<100;jentry++) {
      his->Fill(jentry*0.1);
      hnew->Fill(jentry*0.1);
  }

   TCanvas *c1 = new TCanvas("c1", "c1",4,4,1200,500);
   TPad *c1_1 = new TPad("c1_1", "c1_1",0.,0.,0.35,1);  c1_1->Draw();
   TPad *c1_2 = new TPad("c1_2", "c1_2",0.35,0,0.65,1); c1_2->Draw();

   c1_1->cd();
   his->SetFillColor(kRed);
   his->Draw("BAR");

   c1_2->cd();
   hnew->SetFillColor(kBlue);
   hnew->Draw("HBAR");
}
Thanks,
By using SetFillColor, I have the histograms but without using I have empty histogram. I don’t want a filled histogram.
What do you want ?
I just want to have the line around the histogram.
I used
his->SetLineColor(kBlack);
his->SetFillColor(kWhite);
his->Draw(“BAR”);
But it doesn’t work and the histogram shows nothing.
That’s not possible. The HBAR option only draw the histogram as a filled polygon. The line is not drawn.
Or may be like that:
void hajar2() {
   TH1D *his  = new TH1D("his","",50,-35,35);
   TH1D *hnew = new TH1D("hnew","",50,-35,35);
   for (Long64_t jentry=0; jentry<100;jentry++) {
      his->Fill(jentry*0.1);
      hnew->Fill(jentry*0.1);
  }

   TCanvas *c1 = new TCanvas("c1", "c1",4,4,1200,500);
   TPad *c1_1 = new TPad("c1_1", "c1_1",0.,0.,0.35,1);  c1_1->Draw();
   TPad *c1_2 = new TPad("c1_2", "c1_2",0.35,0,0.65,1); c1_2->Draw();

   c1_1->cd();
   his->SetFillColor(kRed);
   his->Draw("BAR");

   c1_2->cd();
   hnew->SetFillColor(kBlue);
   hnew->SetFillStyle(0);
   hnew->Draw("HBAR");
}
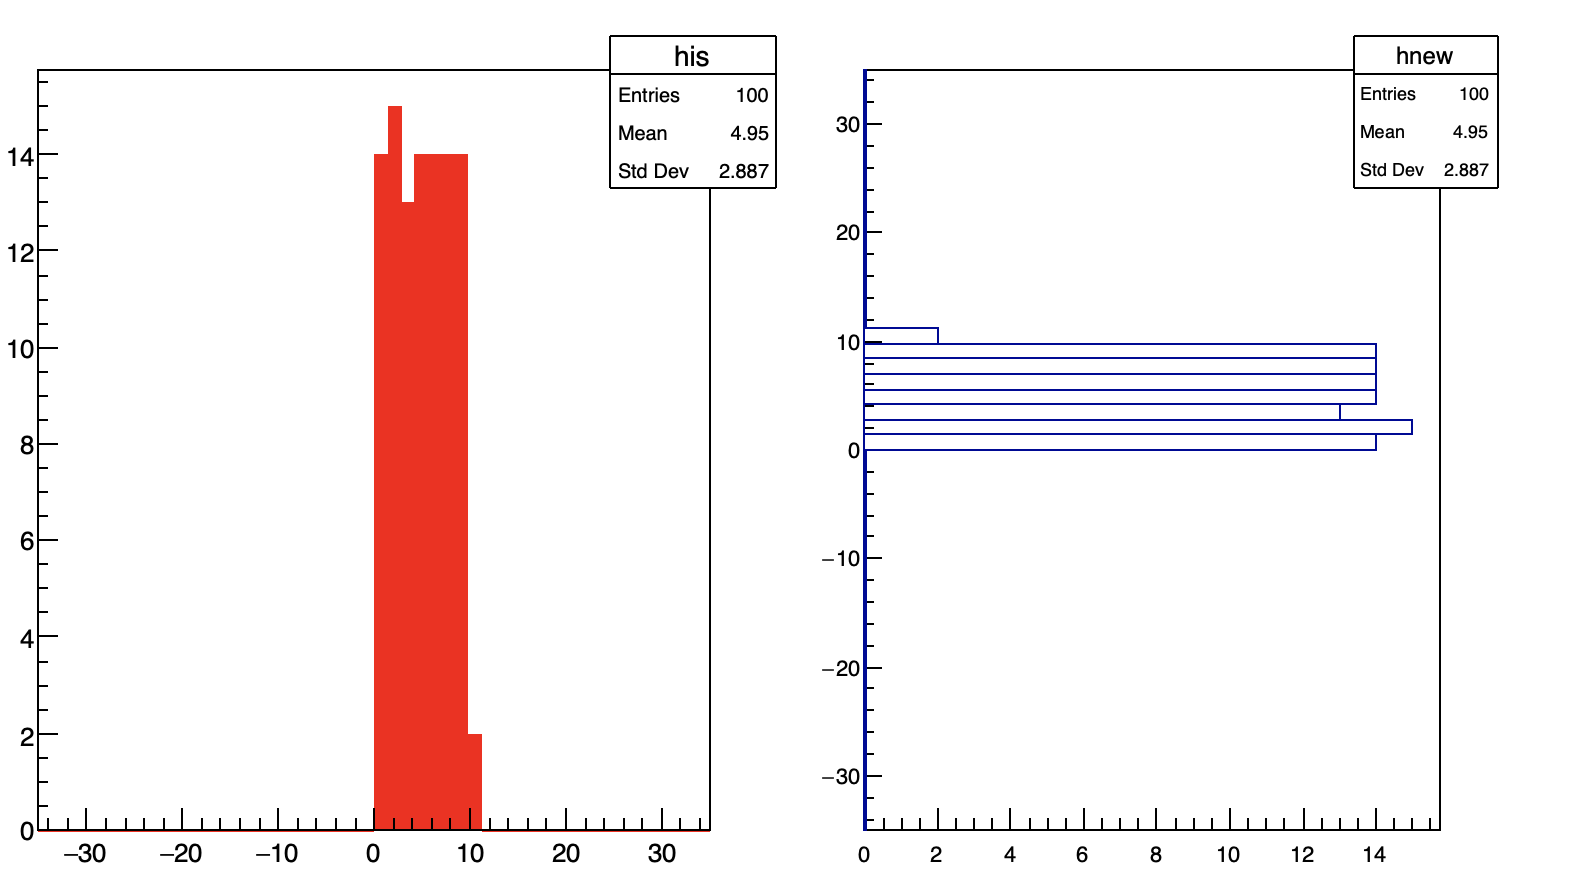
Thanks a lot