Dear experts,
I draw several 4 hist, then on the bottom I want to plot the ratio of only 2 of them. When I used (1),
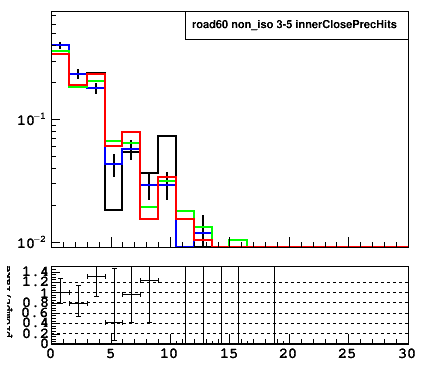
after I call TRatioPlot, it does not draw the 4 hist anymore but only the 2 hist that I call to make the TRatioPlot (2). Also, it does not event Draw them “Normalized” as I asked. Normaly I shoud have this (3) on the top pad. Is it normal that TRatioPlot ignore the previous requested? How can I solve this?
Regards
Dear Couet,
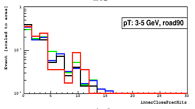
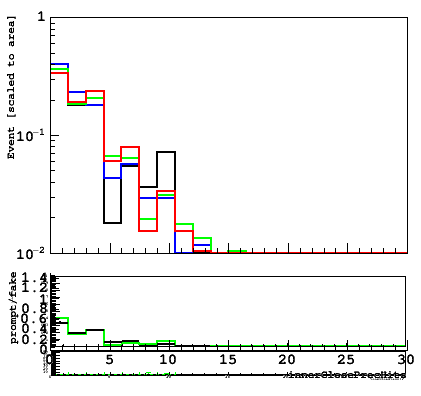
I tried this in (1) but it’s not working. The hist looks like this (2), so sill only 2 hist, and no color etc…
To run this new code, you need 2 more root files (3).
Regards
is there a way to do not draw the large error bars on the TRatioPlot plot when the division return “nan”? Indeed we have a lot of bars in the ratio plot while there are not values.
Regards
You should set the error properly and may be set the error ro 0 hone your computation leads to a wrong result.
It is up to you to decide what is the best solution in that case.
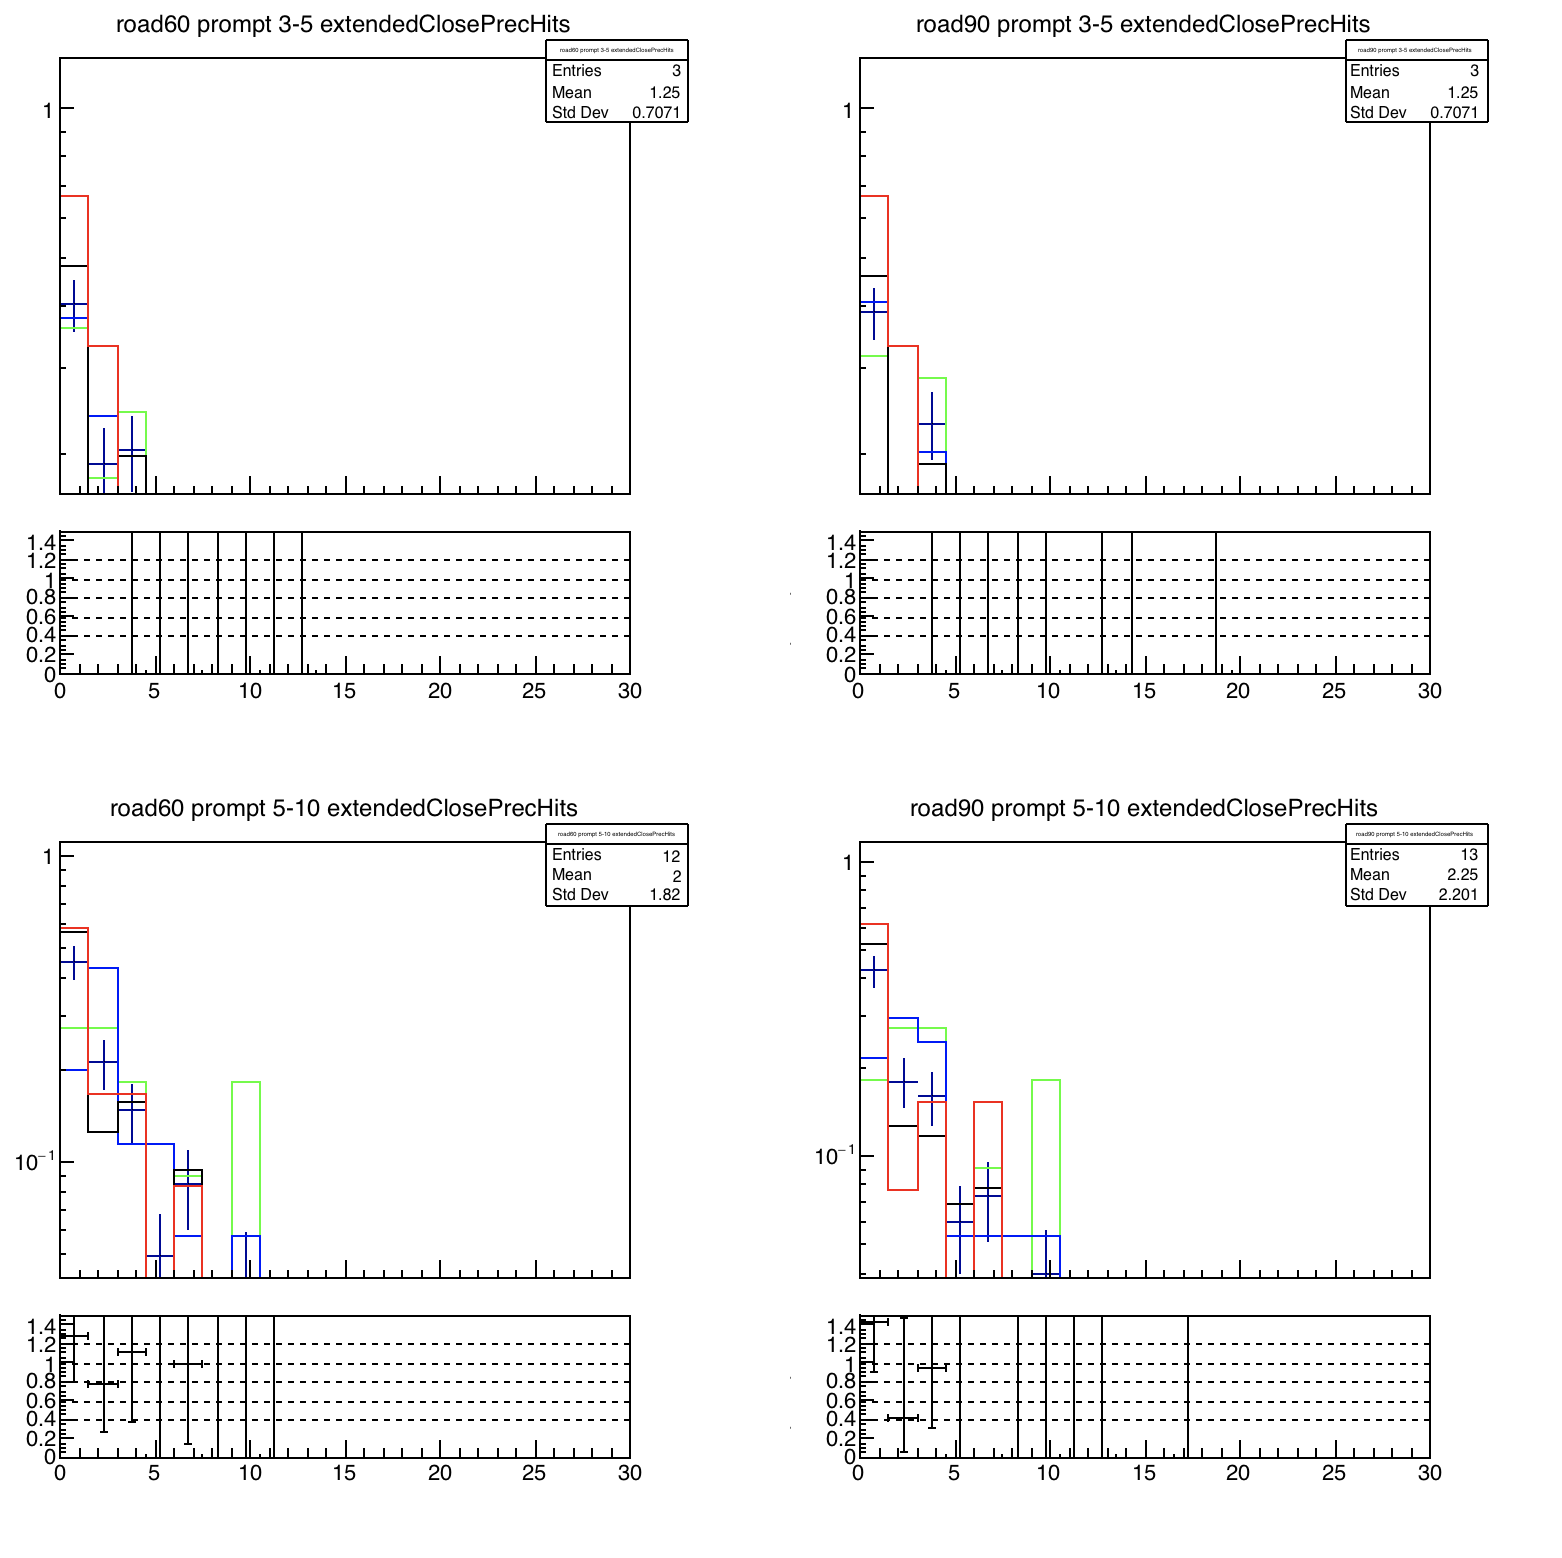
Indeed you are using the option hist for the histograms you are drawing in the top pad on top of the ratio plot (as I told your earlier). But the errors bars you see are coming from the histogram drawn via the ratio plot itself. If you look at the documentation, you will find out that it is possible to change the drawing option of both histograms used to make the ratio plot. In your case: ratio->SetH2DrawOpt("hist"); is the command to be added before ratio->Draw();
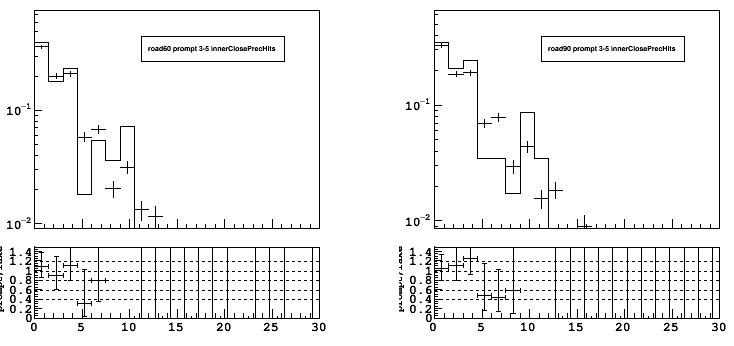
I still want to plot several ratio plots on the lower pad. I saw a suggestion here (1) but it did not work, so I just use something like (2) but it seems to plot the entire frame each time instead of just the curve only, see (3). The complete code is here (4). Do you see what is wrong?
Regards
(1)
(2)
auto ratio_noniso = new TRatioPlot(hist_prompt, hist_fake_noniso);
auto ratio_hadron = new TRatioPlot(hist_prompt, hist_fake_hadron);
auto ratio_other = new TRatioPlot(hist_prompt, hist_fake_other);
//
ratio_noniso → SetH2DrawOpt(“hist”);
ratio_noniso → Draw();
//
ratio_noniso → GetLowerPad()->cd();
ratio_hadron → Draw(“same”);
ratio_other → Draw(“same”);
But if you want the ratio of two other histograms why do you need a new TRatioPLot ? you just need to divide the two histograms, do a cd() to the lower pad of the TRatioPlot and plot (with option same) the result of the division you just did ?
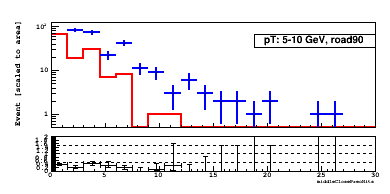
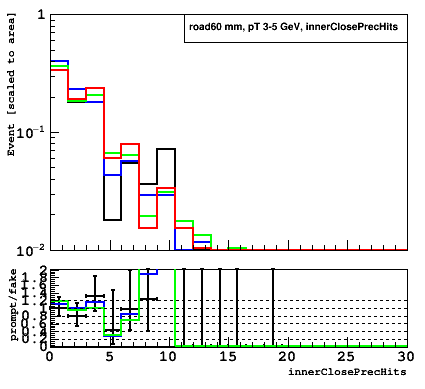
which option should I use to do not draw the error bars of Tratio? As you can see here (1), there are error bar for the black hist on the bottom pad, as I use it to make the TRatio?
Is it possible to plot only the Tratio frame (pad, axis, etc…) and not the graph? Then I could add the hist that I made myself?
Regards
I mean that you use TRatioPlot, the bottom is produced automatically from the two histograms you gave. The bottom plot is generated via a TGraphAsymmErrors, which, obviously, has errors bars.