I need to set a picture as the background of a graph/hist.
I found this thread TCanvas background image which explains how to add a background to the entire canvas. I only need to set the background of the TFrame only.
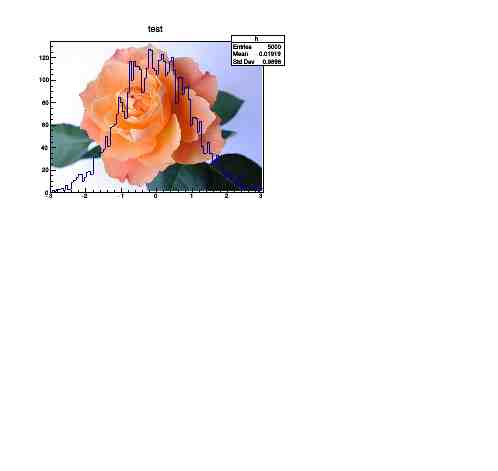
Here is some code to draw the histogram on top of the image. The trick is to add another pad on top of the one used to draw the image. Based on couet’s example:
void imgback()
{
   TImage *img = TImage::Open("$ROOTSYS/tutorials/image/rose512.jpg");
   if (!img) {
      printf("Could not create an image... exit\n");
      return;
   }
   img->SetConstRatio(kFALSE);
   float d = 0.40;
   TCanvas *c1 = new TCanvas("roses", "roses", 500, 500);
   TPad *p1 = new TPad("i1", "i1", 0.05, 0.55, 0.05+d*img->GetWidth()/img->GetHeight(), 0.95);
   TPad *p2 = new TPad("i2", "i2", 0.05, 0.55, 0.05+d*img->GetWidth()/img->GetHeight(), 0.95);
   p2->SetFillColor(0);
   p2->SetFillStyle(0);
   p2->SetFrameFillColor(0);
   p2->SetFrameFillStyle(0);
   p1->Draw();
   p1->cd();
   img->Draw();
   c1->cd();
   p2->Draw();
   p2->cd();
   TH1F *h = new TH1F("h","test",100,-3,3);
   //h->SetFillColor(kCyan);
   h->FillRandom("gaus",5000);
   h->Draw();
   c1->cd();
}
Note that p2 is basically a copy of p1 but made transparent. You draw p1, then the image on p1, then p2 and finally the histogram on p2.
One thing I found is that when saving the canvas to PDF the rose image is not kept, I just get the histogram on a white background (Xubuntu, root 6.14.06). GIF doesn’t work in this case, I guess because of the number of colours; but EPS, JPG and PNG work fine. roses.pdf (14.1 KB)
This is awesome but still a bit far from what I need.
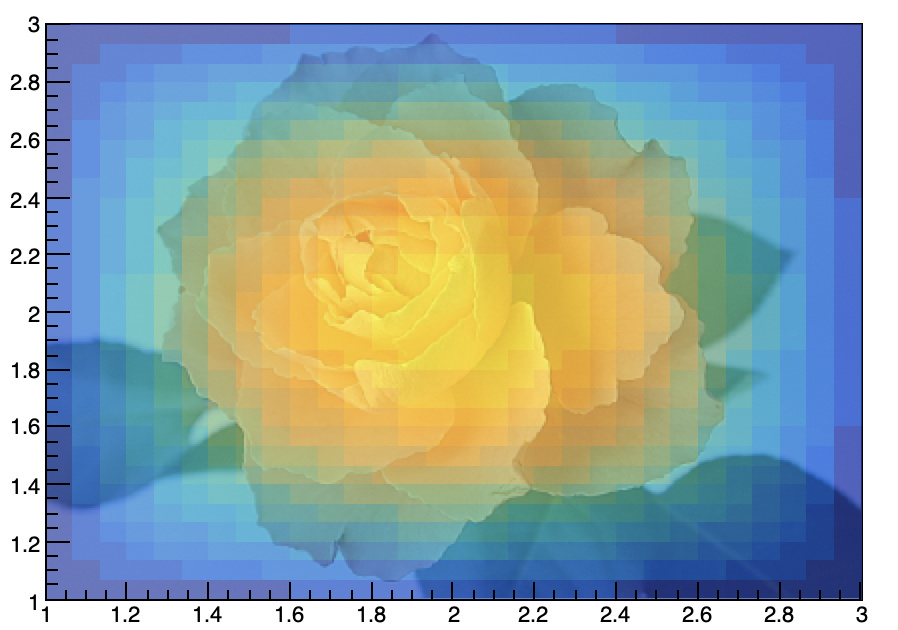
A rose is nice, but I need at the end is a black&white picture showing a particular geometry of a model (I get this from another software) in which I superimpose a TH2D drawn using “colz” option.
I have two questions then:
how to draw the canvas (and thus the frame/pad) so that the image keeps a constant ratio and the image borders coincide with the tpad “p2”?
will the colors of a TH2D drawn using the “colz” option cover the background or is there a way to paint only the white area of the image?
Well… Yeah. But how to do that?
I tried changing the x,y values in the TPad function in the above example, but I can’t set the canvas width and height so that the two tpads coincide.
I haven’t done much indeed.
The fact is that the canvas size&ratio affects the pad size&ratio. It looks like that the two ratios are not the same, so if I set the canvas width and height as shown in the example, the tpads will have another ratio…
That’s weird…
I copy and paste your code -> run it -> the superimposed map is not transparent, but 100% opaque, I can’t see the background image.
Could that be the ROOT version? Mine:
gROOT->GetVersion()
(const char *) "6.14/02"
Anyway, I only slightly understand the logic behind your choice for x,y coordinates in both TPad constructors. I’d call it magic by now.
The transparency is available on all platforms when the flag OpenGL.CanvasPreferGL is set to 1 in $ROOTSYS/etc/system.rootrc , or on Mac with the Cocoa backend. On the file output it is visible with PDF, PNG, Gif, JPEG, SVG … but not PostScript.
That’s just numbers … no magic behind. When you draw a histogram in a pad there is axis and margins around. That’s a TFrame. These margins are equal to .1 by default. that is why I set p1 as I did in order to align the image on the axis.
I’m not confident with both TPads and that “cd()” command, that’s why I need to dig (into the online manual) a little bit before I can fully understand what’s happening in this macro.