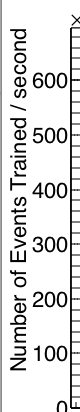
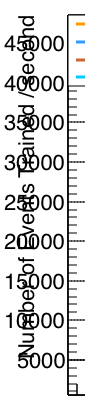
I’m trying to customise one of my plots making more room for an axis label by printing 40 (*10^3) instead of 40000 as the tick label, but I can’t find out what options to use/pass and to what functions. Please advise!
This solution is a good idea but has the problem of putting the label outside of the printable area of the plot
Upon a reread of the post I realise it’s a bit difficult to discern what I am looking for! To clarify a bit more: I want to choose the prefix for the tick labels (e.g. 10^3) so that they take up less horizontal space.
 Ideal: