I have been wondering for a while if there is an automatic way of getting the right y-axis range when plotting two histograms in the same plot with ->Draw(“same”).
The range of the y-axis follows the first histogram plotted, and then the second one may be out of range.
I have now tried THStack and seems like the axis get set nicely.
However, they do not take into account the error bars also, they get cut off.
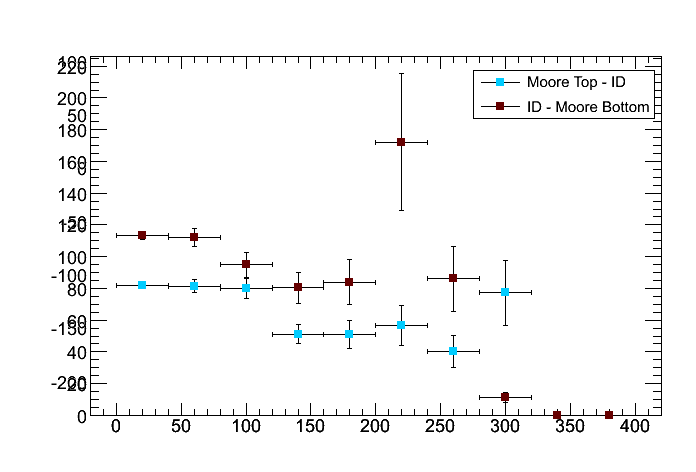
In addition, since I am not really plotting histograms, but points that can be both positive and negative THStack gives me a horizontal line at zero when I plot.
I have attached a plot that shows the situation.
I have also instead tried to use TGraphErrors, but am not immediately happy with that either. If that is the correct way of doing this, I will have some more questions.
When drawing a histogram with pos and neg values you can remove the “0” line by specifying the Draw option “0”.
THStack is for histograms. The equivalent for graphs is the class TMultiGraph.
see examples in the tutorials like $ROOTSYS/tutorials/graphs/multigraph.C
Here is my macro for using multigraph. (It will not run as it is, but you can see what I am trying to do)I have two graphs that I add into the multigraph.
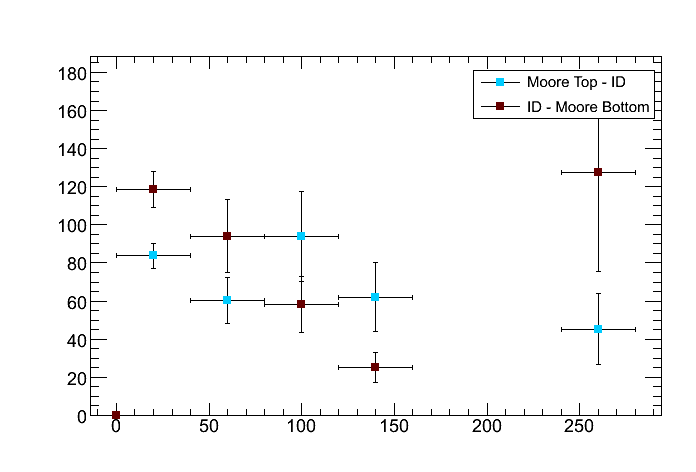
I am looping several times, and creating new multigraphs with new histograms, but my problem is that the multigraph axis just add ontop of each other and dont refresh to fit with the new graphs in the new multigraph. I attach a plot as example.
I tried the following: When filling the initial TGraphErrors I check if the y-value is 0, if it is, I do not fill this specific point. That works fine BUT:
all these points that now are not filled get plotted on top of each other at coordinates x=0, y=0. So I end up with an extra point in my graph. How to get around this?
This is what I do: I have a set of histograms with a distribution each (each histogram corresponds to the distributions with a given pt range). What I then do is loop through these histograms, get the mean and the meanerror and I do SetPoint of graph (a TGraphErrors graph) with these mean value and the meanerror value. It a particular histogram is empty I do not wish to do SetPoint for this value, but leave it out. But I would still like the TGraphErrors graph to have the same number of points as the original histogram has bins.
What happens then is what you see from the last attached plot, the empty points get put at 0,0. and I really want them to be left out all together.
A lot of text, but do you understand?
Maybe even TGraphErrors is not the best way of doing what I wish?
These plots have different y-axis ranges for each plot I am making, and can span over both positive and negative values. I would like not to have to set the minimum value for each plot, as this is exactly what I am trying to have automized with TMultiGraph (or THStack).
With THStack that I tried initially I do not have the problem of the empty bins, as the bins stay empty as I wish. The problem here however was that I did not manage to make the histogram axis also take into acount the error bars of the entries as these ended up outside the plot. Also, I needed to add 0 to the draw option to remove the horizontal line at 0 which was okay, but if I can find a solution that both gives me a plot without a horizontal line at zero AND that the error-bars stay within the plot I would be extremely grateful.