Dear experts,
The figure below shows the signal and background distribution of the “isolation value” drawn directly from the sample [1], [2].
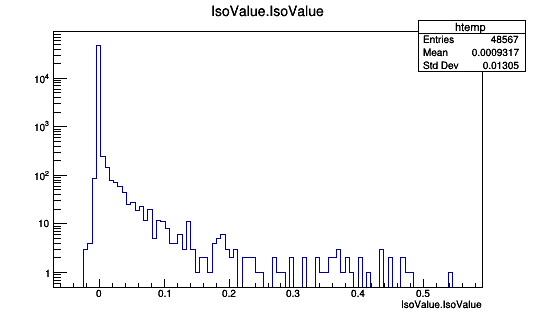
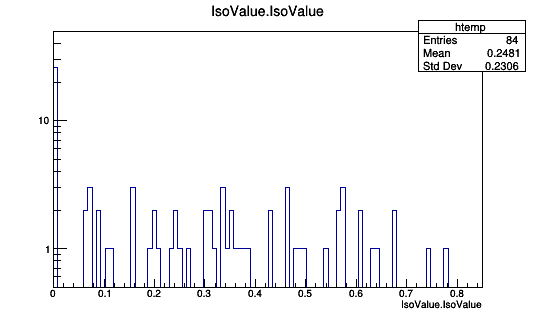
I train the classifier using isolation value and got the TMVA output file.
When I checked the input variable distribution in the output file, I found the X-axis is not matched with distribution from sample. I thought this difference occurred because it was a training sample, and i tried to retrain the entries of the training sample to 99% of the total sample, but the problem still hasn’t been solved.
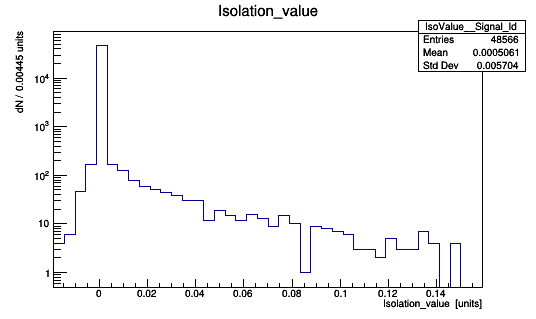
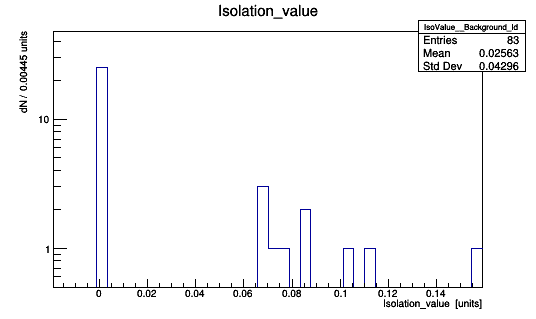
The followings are distributions from TMVA output file (99% training sample) [3].
I tried to fix it using SetRangeUser, SetLimits and change the option of AddVariable on classification macro, but it did not work.
I would appreciate any comments or advice you can give me on this.
Best regards,
Hokyeong
[1] Signal sample
https://cernbox.cern.ch/index.php/s/BvrpxAw1zy0PY2m
[2] Background sample
https://cernbox.cern.ch/index.php/s/XpZL5hO1L83iRrt
[3] TMVA output file
output_SE_R1.root (263.1 KB)
Hi,
Would you mind trying the below in your terminal? This basically inspects the input data (as TMVA sees it) directly instead of going through automatically generated plots (these are designed to be helpful over a wide variety of cases but might miss a few edge cases).
# The below is a little simplified. Let me know if you have questions.
$ root -l output_SE_R1.root
root [0] Dataset_SE_R1->cd()
root [1] TrainTree->Draw("IsoValue", "className==\"Background\"")
Cheers,
Kim
Hi Kim,
Thanks to your reply, I succeeded in plotting the distribution of signal and background.
Let me ask you one more question.
I would like to draw signal (blue color) and background (red color) together on the same canvas as input variable distribution of TMVAGui. Is there a way to do this on terminal?
Best regards,
Hokyeong
Hi,
Please see these links:
https://root.cern.ch/root/htmldoc/guides/users-guide/ROOTUsersGuide.html#drawing-histograms
https://root.cern.ch/root/htmldoc/guides/users-guide/ROOTUsersGuide.html#simple-analysis-using-ttreedraw
This can serve as a starting point:
root -l output_SE_R1.root
root [1] Dataset_SE_R1->cd()
root [2] gStyle->SetPalette(kRust);
root [3] TrainTree->Draw("IsoValue", "className==\"Background\"", "PLC");
root [4] TrainTree->Draw("IsoValue", "className==\"Signal\"", "SAME PLC");
If you want more customisation: Draw first to individual histograms, then compose.
TrainTree->Draw("IsoValue>>hbkg", "className==\"Background\"");
TrainTree->Draw("IsoValue>>hsig", "className==\"Signal\"");
TH1F *hbkg = (TH1F*)gPad->GetPrimitive("hbkg");
TH1F *hsig = (TH1F*)gPad->GetPrimitive("hsig");
Cheers,
Kim