Hello!
I recently ended my internship were I learned the basics of Root pragraming. During the internship I was given a PC which runned ubuntu. Now, back home I am using OSX. I didn’t want to install ubuntu on my mac so I installed root on it.
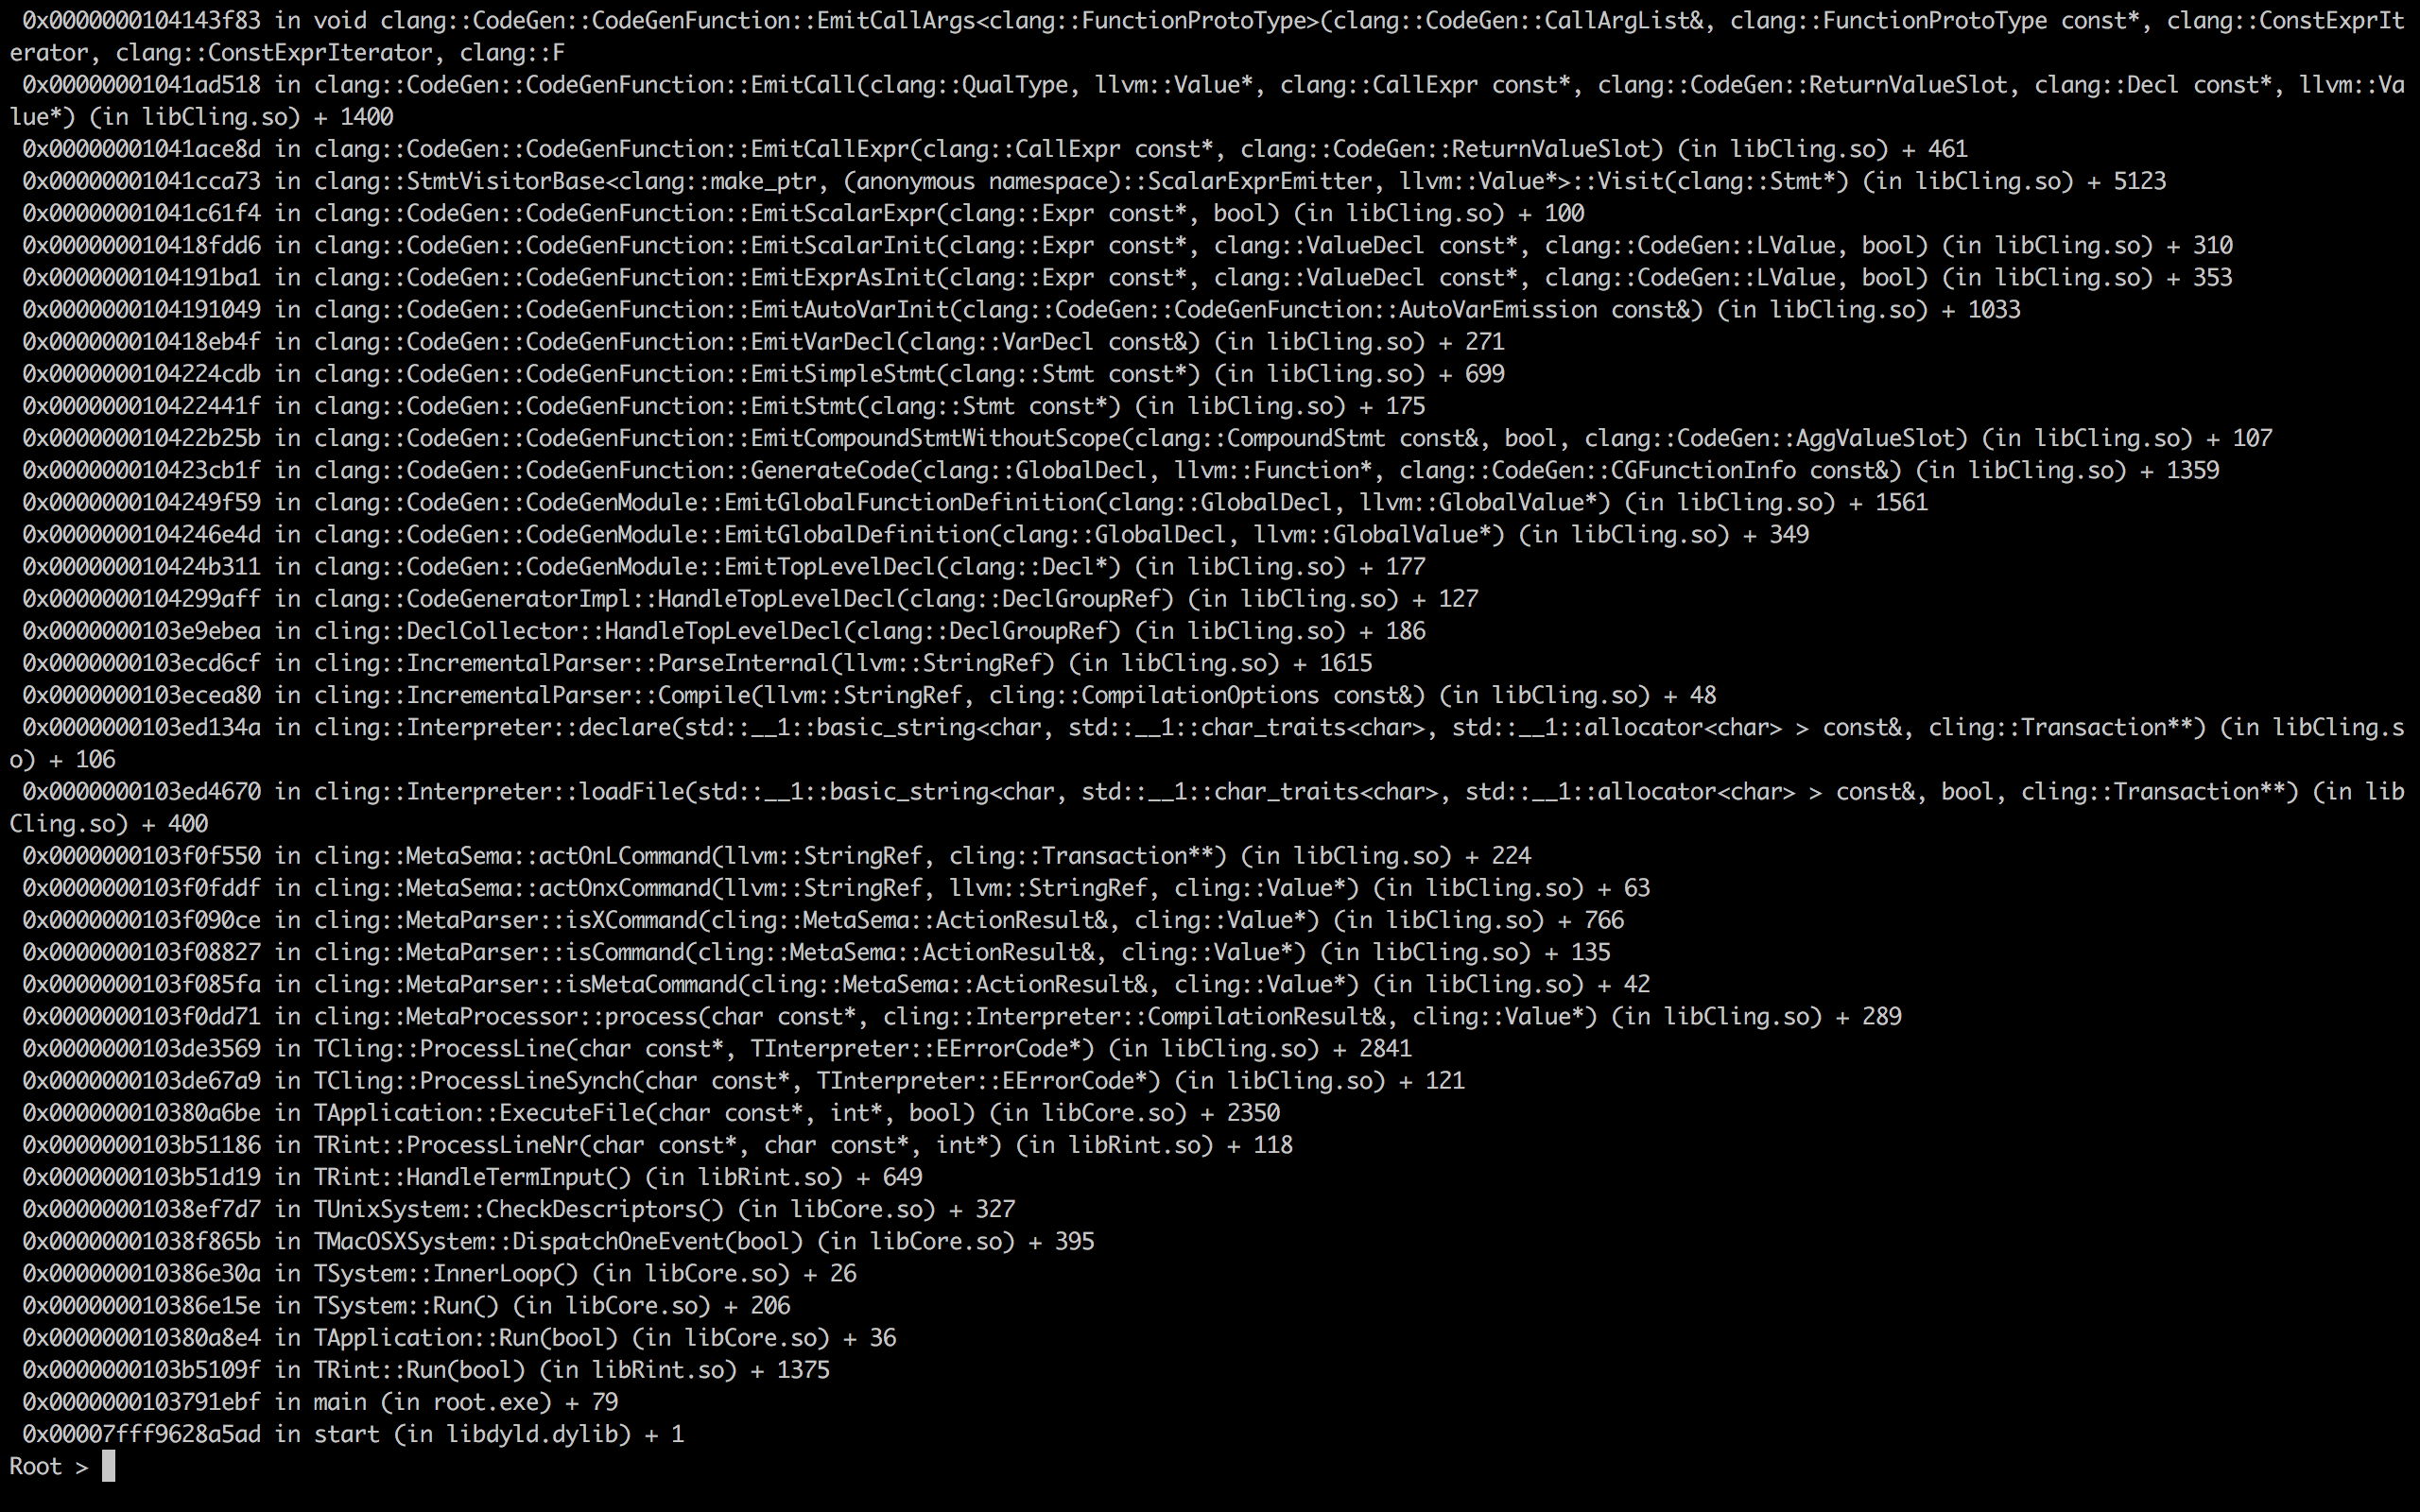
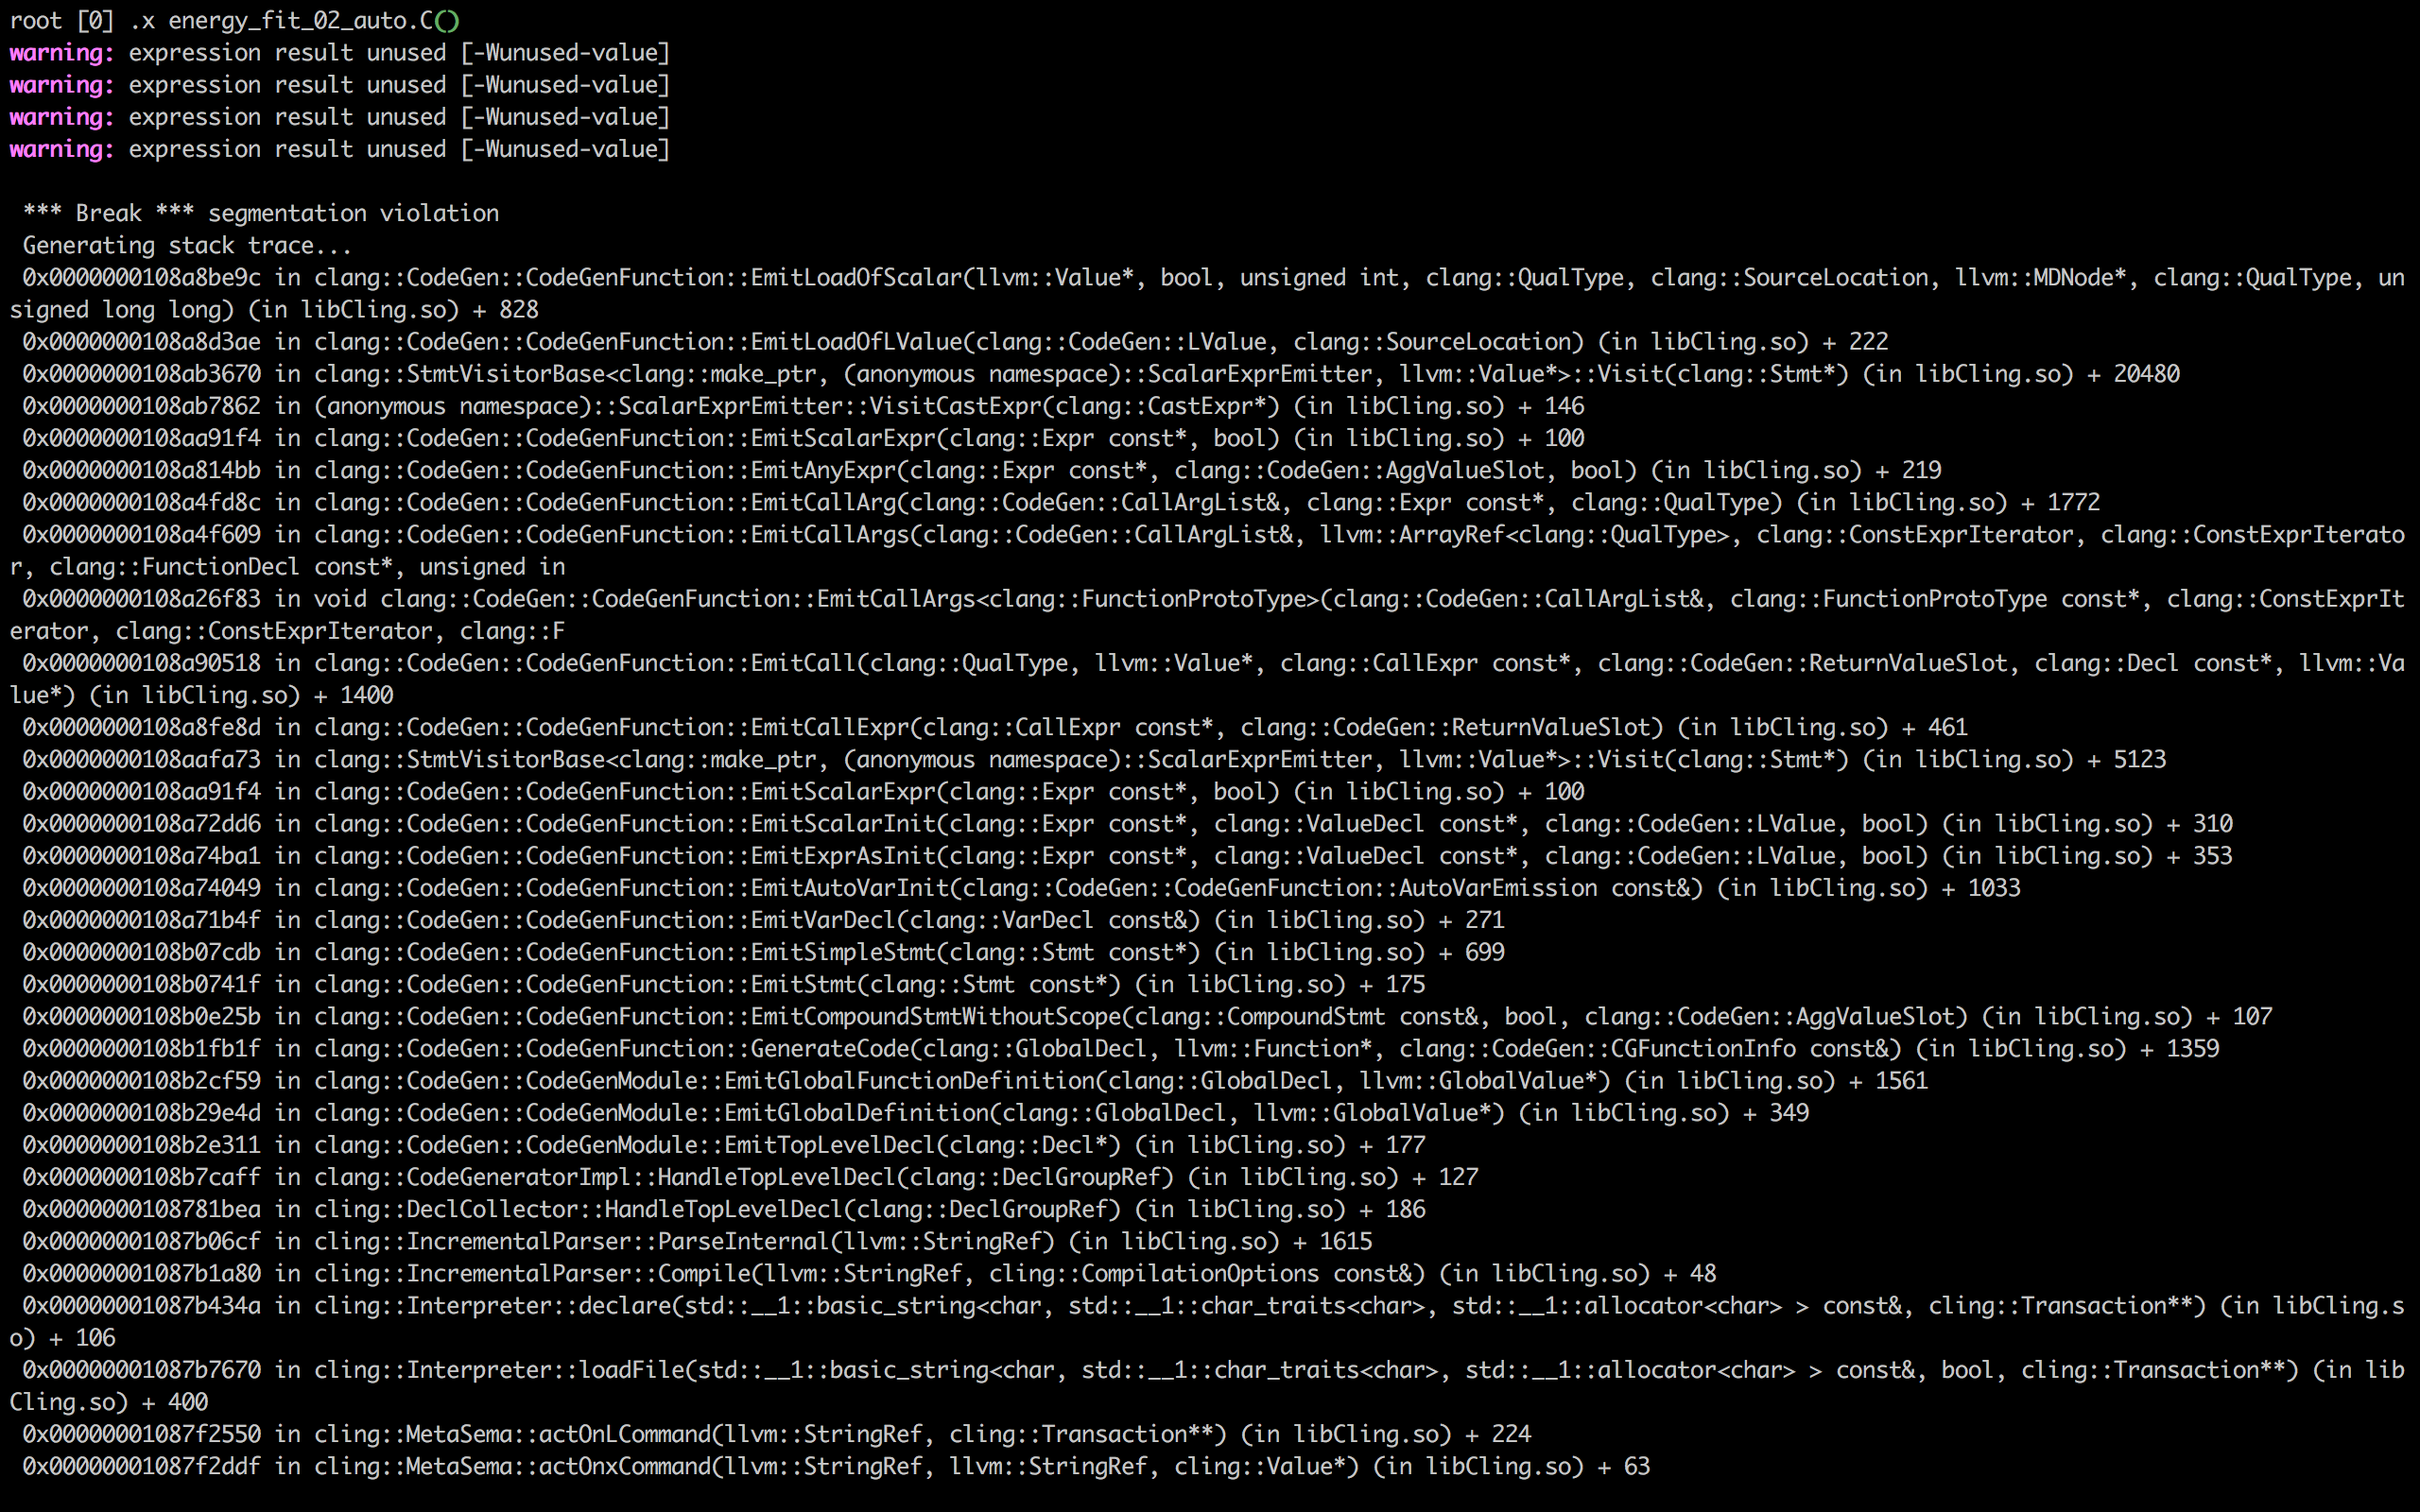
The problem is now that when I run some programs which worked on ubuntu they don’t work on mac. The images attached show what terminal returns me when I try to run the program. Also, I included the used code. Please can you help me to solve this problem?
Thanks, Robert!
[code]//defines a string in order to acces all the files I need for the histogram fitting
const char *GetID(Int_t type)
{
TString name = “”;
name += type;
return name.Data();
}
// Creates automatic fits to the histograms from the files obtained and makes a postion reconstruction.
void energy_fit_02_auto()
{
Double_t x[100], y[100], z[100], l[100];
Int_t n = 20;
	for (Int_t i(0);i<21;i++){
	    st = GetID(i);
		if (i==0)
		{
                     TFile *fn = TFile::Open("../reco/pass1/16.07.18/16.07.18-Calib.SPECTRUM.root");

		}

		else if (i>=1 && i<10)
		{

		TFile *fn = TFile::Open(Form("../reco/pass1/16.07.18/16.07.18-FeX_02_0%s0.SPECTRUM.root", st));
		}
		else
		{

		TFile *fn = TFile::Open(Form("../reco/pass1/16.07.18/16.07.18-FeX_02_%s0.SPECTRUM.root", st));
		cout<<"st="<<st<<endl;
		}


			TTree *tree = (TTree*)gFile->Get("fe");
			TCanvas *c1 = new TCanvas("c1", " Ratio of the small peaks to the total Area 02", 0,0, 600, 600);
			c1->cd(1);
			tree->Draw("e>>h(100, 0., 3000.)","y<0.4 && y>-0.26 && x+c>5.4 && x+c<6.6 && nt>=2");
            TH1 *h = (TH1*)gROOT->FindObject("h");
			h->GetXaxis()->SetTitle("Energy, A.U.");
			h->GetYaxis()->SetTitle("Counts");
			tree->Draw("e>>h4(100, 0., 3000.)","e>700 && e<1000 ");
            TH1 *h4 = (TH1*)gROOT->FindObject("h4");


			TH1F *h1 = (TH1F*)h->Clone("h1");// represents the energy spectrum
			TH1F *h5= (TH1F*)h4->Clone("h5");
//the next three lines fit the big peak
Double_t xmax = h1->GetBinCenter(h1->GetMaximumBin()), rms(300.);
TF1 *g1=new TF1(“g1”,“gaus”, xmax-rms, xmax+250);
h1->Fit(g1,“R”);
			Double_t xmax2 = h5->GetBinCenter(h5->GetMaximumBin());
			cout<<"xmax2="<<xmax2<<endl;

			TF1 *g2=new TF1("g2","gaus", xmax2-130,xmax2+130);
			h1->Fit(g2,"R+");

			Double_t chi2=g2->GetChisquare();
			Double_t chi1=g1->GetChisquare();
			Double_t mean1fit=h1->GetFunction("g1")->GetParameter(1);
			Double_t mean2fit=h1->GetFunction("g2")->GetParameter(1);

			cout<<"chi1="<<chi1<<endl;
			cout<<"chi2="<<chi2<<endl;

			h1->Draw();

			//The next block plots the postion on y and x axis.
			TCanvas *c2 = new TCanvas("c2", "The two fitted gausians summed",600,600);
			tree->Draw("y:x+c>>h2(10200, 10., 100.)","e>2000");// Draws the position of the detected particles when their energy is larger than 2000 arbitrary units
            TH1 *h2 = (TH1*)gROOT->FindObject("h2");


			c2->cd(2);
			h2->GetXaxis()->SetTitle("Position on X");
			h2->GetYaxis()->SetTitle("Position on Y");

			// create a file in which you save the histogram fitted by the two gaussians
			TFile f("output_energy_fit_00.root","recreate");
			h1->Write();
			f.Close();

			//start the area calculation procedure. Comment all this bulk if you wan only the fitting procedure


    g1 = (TF1*)h1->GetListOfFunctions()->At(0);//This "At(0)" function seems to make the addition between the two gaus fittings.
    g2 = (TF1*)h1->GetListOfFunctions()->At(1);
g1->SetRange(0, 3000);//These two lines take the gaussian fits and make them longer such as to see some nice gaussian shapes. If we set directly the range of g1 and g2 to be larger then the fit won't be so good.
g2->SetRange(0, 3000);

TF1 *gt = new TF1("gt", "gaus(0)+gaus(3)", 0, 3000);//defines a new function gt which makes the addition between the two gaus fits.
gt->SetLineColor(kBlue);//the addition will be blue colored
for(Int_t ip(0); ip<3; ip++){//This for loop makes the addition of the two gausians
	gt->SetParameter(ip, g2->GetParameter(ip));// Takes the parameter from the gaussians (g2 in this case g1 for the next line) and inserts them into gt function which has to be plotted.
	gt->SetParameter(ip+3, g1->GetParameter(ip));// It is observed that this thing works only with ip+3 this meaning that each one of the 6 parameters are filled. THerefore the function can be plotted.
		}
h1->Draw();
gt->SetLineColor(kBlue);
gt->Draw(“same”);
Float_t FePeak = 100.*g1->Integral(0, 3000)/gt->Integral(0, 3000);
Float_t ArPeak = 100.*g2->Integral(0, 3000)/gt->Integral(0, 3000);
printf(“FePeak Surface Ratio=[%f] Ar Escape Peak Ratio[%f]\n”, FePeak, ArPeak);
y[i]=FePeak;
if (i==0){x[i]=0;}
else x[i]=x[i-1]+10;
z[i]= mean1fit;
l[i]=mean2fit;
}
TCanvas *c123= new TCanvas(“name”,“title”, 600,600);
c123-> Divide(1,3);
c123->cd(1);
gr_surfaceratios = new TGraph(n,x,y);
gr_surfaceratios->SetTitle(“Surface ratio of the 55Fe peak”);
gr_surfaceratios->Draw(“ac*”);
c123->cd(2);
gr_energyMean2= new TGraph(n,x,l);
gr_energyMean2->SetTitle(“Mean of the fitted gaussian functio (Ar peak) vs the intensity of the X Ray tube,Intensity of the X Ray Tube (uA),Mean of the fitted Ar peak (A.U.)”);
gr_energyMean2->Draw(“AC*”);
c123->cd(3);
gr_energyMean1 = new TGraph(n,x,z);
gr_energyMean1->Fit(“pol1”);
gr_energyMean1->SetTitle(“Mean of the fitted gausian vs the intensity of the X-Ray tube”);
gr_energyMean1 ->Draw(“AC*”);
}
[/code]