I want to get the Integral of the gaus function betwwen one interval, but the result I have get is so large that I think it should not be large like this. The first integral I get is 62.309636; and the second integral I get is 1087.046402
This is my code, and please tell me where is the problem.
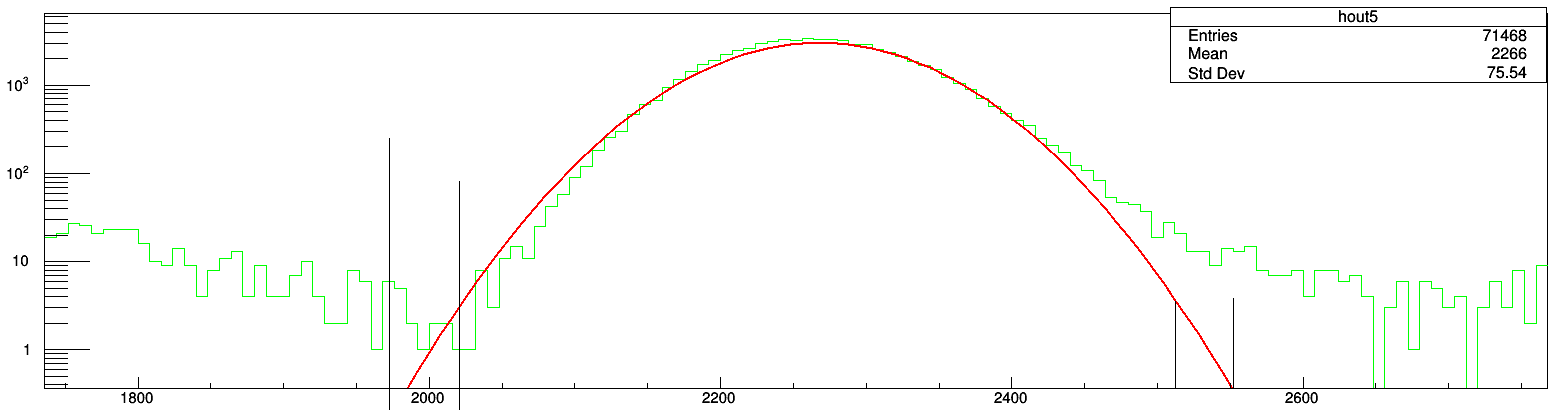
The red curve in the plot is not the “expfir7gs” (obviously, different parameters’ values are used).
Also, the drawn short black vertical lines do not correspond to the integrals’ limits (obviously, at least the first one is completely different).
Why it used the parameters not correspond to the fit funtion( the red curve) ?
and why the integral’s limit is also not corrsspond to the drawn short vertical lines ?
and how I can use the red curve’s parameters to get integral with the right integral limit?